关于(about)
由于翻译质量不高,所以合成为中英对照双语版本,如有不当之处,可联系修正,感谢你的支持。
贡献者(Contributor)
-
Andy.Ren(rcl026@163.com)
-
杯子(5284794@qq.com)
-
JewelKnife(215851331@qq.com)
-
甘明(xyuu@xyuu.net)
This project provides Netflix OSS integrations for Spring Boot apps through autoconfiguration and binding to the Spring Environment and other Spring programming model idioms. With a few simple annotations you can quickly enable and configure the common patterns inside your application and build large distributed systems with battle-tested Netflix components. The patterns provided include Service Discovery (Eureka), Circuit Breaker (Hystrix), Intelligent Routing (Zuul) and Client Side Load Balancing (Ribbon).
该项目通过自动配置和绑定到Spring环境和其他Spring编程模型惯例,为Spring Boot应用程序提供Netflix OSS集成。 通过几个简单的注释,您可以快速启用和配置应用程序中的常见功能模块,并使用久经考验的Netflix组件构建大型分布式系统。 提供的功能模块包括服务发现(Eureka),断路器(Hystrix),智能路由(Zuul)和客户端负载均衡(Ribbon)。
服务发现:Eureka客户端(Service Discovery: Eureka Clients)
Service Discovery is one of the key tenets of a microservice based architecture. Trying to hand configure each client or some form of convention can be very difficult to do and can be very brittle. Eureka is the Netflix Service Discovery Server and Client. The server can be configured and deployed to be highly available, with each server replicating state about the registered services to the others.
服务发现是microservice基础架构的关键原则之一。试图着手配置每个客户端或某种格式的约定可以说是非常困难的和非常脆弱的。Eureka是Netflix服务发现的一种服务和客户端。这种服务是可以被高可用性配置的和部署,并且在注册的服务当中,每个服务的状态可以互相复制给彼此。
注册到Eureka(Registering with Eureka)
When a client registers with Eureka, it provides meta-data about itself such as host and port, health indicator URL, home page etc. Eureka receives heartbeat messages from each instance belonging to a service. If the heartbeat fails over a configurable timetable, the instance is normally removed from the registry.
当一个客户端注册到Eureka,它提供关于自己的元数据(诸如主机和端口,健康指标URL,首页等)Eureka通过一个服务从各个实例接收心跳信息。如果心跳接收失败超过配置的时间,实例将会正常从注册里面移除。
Example eureka client:
eureka 客户端例子:
@Configuration
@ComponentScan
@EnableAutoConfiguration
@EnableEurekaClient
@RestController
public class Application {

    @RequestMapping("/")
    public String home() {
        return "Hello world";
    }

    public static void main(String[] args) {
        new SpringApplicationBuilder(Application.class).web(true).run(args);
    }

}
(i.e. utterly normal Spring Boot app). In this example we use
@EnableEurekaClient explicitly, but with only Eureka available you
could also use @EnableDiscoveryClient. Configuration is required to
locate the Eureka server. Example:
在这个例子里我们使用
@EnableEurekaClient 来声明, 但只有使 Eureka 生效还得
使用 @EnableDiscoveryClient。 配置要求
定位Eureka服务端。 例如:
eureka:
  client:
    serviceUrl:
      defaultZone: http://localhost:8761/eureka/
where "defaultZone" is a magic string fallback value that provides the service URL for any client that doesn’t express a preference (i.e. it’s a useful default).
"defaultZone"是一个神奇的字符串回退值,它提供了服务的URL给任何客户端,而这不意味优先级。 (i.e. 是一个常用的默认值).
The default application name (service ID), virtual host and non-secure
port, taken from the Environment, are ${spring.application.name},
${spring.application.name} and ${server.port} respectively.
默认应用名(服务ID),物理主机地址和非安全端口, 分别从环境的 ${spring.application.name},
${spring.application.name} 和 ${server.port} 获取。
@EnableEurekaClient makes the app into both a Eureka "instance"
(i.e. it registers itself) and a "client" (i.e. it can query the
registry to locate other services). The instance behaviour is driven
by eureka.instance.* configuration keys, but the defaults will be
fine if you ensure that your application has a
spring.application.name (this is the default for the Eureka service
ID, or VIP).
@EnableEurekaClient 使Eureka做为一个实例(注册直接)和客户端(它能通过查找注册来定位其它服务)注册到应用里面。实例的行为由eureka.instance.*的配置项来决定,但是你最好确保你的spring.application.name有个默认值。(这是Eureka的默认ID或VIP)。
See EurekaInstanceConfigBean and EurekaClientConfigBean for more details of the configurable options.
更多配置项的细节请看 EurekaInstanceConfigBean and EurekaClientConfigBean 。
对Eureka服务的身份验证(Authenticating with the Eureka Server)
HTTP basic authentication will be automatically added to your eureka
client if one of the eureka.client.serviceUrl.defaultZone URLs has
credentials embedded in it (curl style, like
http://user:password@localhost:8761/eureka). For more complex needs
you can create a @Bean of type DiscoveryClientOptionalArgs and
inject ClientFilter instances into it, all of which will be applied
to the calls from the client to the server.
如果其中一个eureka.client.serviceUrl.defaultZone的url已经把凭证嵌入到它里面,那么HTTP基本的身份验证将会被自动添加到你的eureka客户端(curl风格,如 http://user:password@localhost:8761/eureka)。
对于更复杂的需求,您可以创建一个带“@Bean”注解的“DiscoveryClientOptionalArgs”类型并且为它注入“ClientFilter”实例。
| Because of a limitation in Eureka it isn’t possible to support per-server basic auth credentials, so only the first set that are found will be used. |
| 由于Eureka的一个限制是不可能支持每个服务器基本授权认证,所以只被发现的第一组会被使用。 |
健康指标和状态页面(Status Page and Health Indicator)
The status page and health indicators for a Eureka instance default to
"/info" and "/health" respectively, which are the default locations of
useful endpoints in a Spring Boot Actuator application. You need to
change these, even for an Actuator application if you use a
non-default context path or servlet path
(e.g. server.servletPath=/foo) or management endpoint path
(e.g. management.contextPath=/admin). Example:
健康指标和状态页面分别对应一个Eureka实例的"/health"和"/info",是在一个Spring Boot Actuator应用默认的配置位置中很有用的一个点。即便是一个Actuator应用,如果你使用非默认的上下文路径或者servlet路径(如server.servletPath=/foo)或管理端点的路径(如management.contextPath=/admin),你都需要做出相应的改变。例如:
eureka:
  instance:
    statusPageUrlPath: ${management.context-path}/info
    healthCheckUrlPath: ${management.context-path}/health
These links show up in the metadata that is consumed by clients, and used in some scenarios to decide whether to send requests to your application, so it’s helpful if they are accurate.
这些链接呈现出在元数据所消耗的客户端,并且使用在某些情况下决定是否发送请求给你应用程序,如果这些信息准确的话它们是有用的。
注册一个安全应用(Registering a Secure Application)
If your app wants to be contacted over HTTPS you can set two flags in
the EurekaInstanceConfig, viz
eureka.instance.[nonSecurePortEnabled,securePortEnabled]=[false,true]
respectively. This will make Eureka publish instance information
showing an explicit preference for secure communication. The Spring
Cloud DiscoveryClient will always return an https://…; URI for a
service configured this way, and the Eureka (native) instance
information will have a secure health check URL.
如果你的应用想通过HTTPS被联系上你需要设置两个标记,分别是EurekaInstanceConfig, viz
eureka.instance.[nonSecurePortEnabled,securePortEnabled]=[false,true]。这将使Eureka推送实例的信息展示一个显式的安全通信。Spring
Cloud的DiscoveryClient将总是通过这种方式返回一个服务的配置的URI(https://…;), 并且Eureka实例(native)的信息将有一个安全的健康检查的URL。
Because of the way Eureka works internally, it will still publish a non-secure URL for status and home page unless you also override those explicitly. You can use placeholders to configure the eureka instance urls, e.g.
因为Eureka的内部工作方式,它将继续推送一个非安全的URL的状态和主页,除非你还覆盖那些声明。你可以使用占位符娶配置eureka实例的url。 例子:
eureka:
  instance:
    statusPageUrl: https://${eureka.hostname}/info
    healthCheckUrl: https://${eureka.hostname}/health
    homePageUrl: https://${eureka.hostname}/
(Note that ${eureka.hostname} is a native placeholder only available
in later versions of Eureka. You could achieve the same thing with
Spring placeholders as well, e.g. using ${eureka.instance.hostName}.)
(请注意 ${eureka.hostname} 是一个原生占位符只可用在以后的版本的Eureka.你也可以使用Spring的占位符做同样的事情, 例如使用 ${eureka.instance.hostName}.)
| If your app is running behind a proxy, and the SSL termination is in the proxy (e.g. if you run in Cloud Foundry or other platforms as a service) then you will need to ensure that the proxy "forwarded" headers are intercepted and handled by the application. An embedded Tomcat container in a Spring Boot app does this automatically if it has explicit configuration for the 'X-Forwarded-\*` headers. A sign that you got this wrong will be that the links rendered by your app to itself will be wrong (the wrong host, port or protocol). |
| 如果你的应用在慢于一个代理启动运行,并且SSL终端在代理里面(如:如果你的应用作为一个服务在Cloud Foundry或其它平台上跑的话),那么你将要确保应用能够拦截和处理代理转发的头信息。如果它明确配置有'X-Forwarded-\*`这类头信息的情况下,在一个Spring Boot应用里面内嵌的Tomcat容器自动处理的。出现这个错误的原因,是因为你的应用程序提供的链接本身弄错了。(错误的主机,端口,协议)。 |
Eureka 健康检查(Eureka’s Health Checks)
By default, Eureka uses the client heartbeat to determine if a client is up. Unless specified otherwise the Discovery Client will not propagate the current health check status of the application per the Spring Boot Actuator. Which means that after successful registration Eureka will always announce that the application is in 'UP' state. This behaviour can be altered by enabling Eureka health checks, which results in propagating application status to Eureka. As a consequence every other application won’t be sending traffic to application in state other then 'UP'.
默认情况下,Eureka使用客户端心跳来确定一个客户端是否活着。除非另有指定Discovery Client不会传播当前Spring Boot Actuator的应用性能的健康检查状态。也就是说在成功注册Eureka后总会宣布的应用程序在“UP”的状态。这种发送应用状态给Eureka的行为将触发Eureka的健康检查。因此其他每个应用程序在其他状态下不会给应用程序发送通信然后才‘UP’。
eureka:
  client:
    healthcheck:
      enabled: true
If you require more control over the health checks, you may consider
implementing your own com.netflix.appinfo.HealthCheckHandler.
如果你有更多超出健康检查的监控,你可以考虑实现自己的com.netflix.appinfo.HealthCheckHandler.
Eureka给客户端和实例的元数据(Eureka Metadata for Instances and Clients)
It’s worth spending a bit of time understanding how the Eureka metadata works, so you can use it in a way that makes sense in your platform. There is standard metadata for things like hostname, IP address, port numbers, status page and health check. These are published in the service registry and used by clients to contact the services in a straightforward way. Additional metadata can be added to the instance registration in the eureka.instance.metadataMap, and this will be accessible in the remote clients, but in general will not change the behaviour of the client, unless it is made aware of the meaning of the metadata. There are a couple of special cases described below where Spring Cloud already assigns meaning to the metadata map.
值得花一点时间了解Eureka元数据是如何工作的,所以你可以使用它的方式在你的平台是有意义的。有标准的元数据,如主机名、IP地址、端口号、状态页面和健康检查。这些元数据在服务注册和客户端联系服务端时以一种简单的方式被推送出去。额外的元数据可以被添加到实例注册在eureka.instance.metadataMap里面,并且这都是在远程客户端可访问到的,但通常不会改变客户的行为,除非它是识别到元数据的含义。有一些特殊的情况:Spring Cloud已经分配元数据映射的含义。
在 Cloudfoundry 使用 Eureka(Using Eureka on Cloudfoundry)
Cloudfoundry has a global router so that all instances of the same app have the same hostname (it’s the same in other PaaS solutions with a similar architecture). This isn’t necessarily a barrier to using Eureka, but if you use the router (recommended, or even mandatory depending on the way your platform was set up), you need to explicitly set the hostname and port numbers (secure or non-secure) so that they use the router. You might also want to use instance metadata so you can distinguish between the instances on the client (e.g. in a custom load balancer). By default, the eureka.instance.instanceId is vcap.application.instance_id. For example:
Cloudfoundry有总的路由,所有在同个应用的实例有相同的主机名(在其他PaaS解决方案有类似的架构和这一样)。这不妨碍我们使用Eureka,但如果你使用路由(推荐,甚至强制性的根据您的平台建立的方式),你需要显式地设置主机名和端口号(安全或不安全的),以便他们使用路由器。您可能还希望使用实例元数据,这样你就可以区分在客户端实例(如:在一个定制的负载均衡器)。默认情况下,eureka.instance.instanceId相当于vcap.application.instance_id。例如:
eureka:
  instance:
    hostname: ${vcap.application.uris[0]}
    nonSecurePort: 80
Depending on the way the security rules are set up in your Cloudfoundry instance, you might be able to register and use the IP address of the host VM for direct service-to-service calls. This feature is not (yet) available on Pivotal Web Services (PWS).
按照规则把安全规则设置在你的Cloudfoundry实例里面,你就可以通过服务到服务的调用方式注册和使用主机虚拟机的IP地址。这个功能还没有可以在关键的Web服务。 (PWS).
在AWS上使用Eureka(Using Eureka on AWS)
If the application is planned to be deployed to an AWS cloud, then the Eureka instance will have to be configured to be Amazon aware and this can be done by customizing the EurekaInstanceConfigBean the following way:
假如应用要计划部署到AWS云,那么Eureka实例必须配置为亚马逊可识别的并且可以通过以下方式定制 EurekaInstanceConfigBean :
@Bean
@Profile("!default")
public EurekaInstanceConfigBean eurekaInstanceConfig() {
  EurekaInstanceConfigBean b = new EurekaInstanceConfigBean();
  AmazonInfo info = AmazonInfo.Builder.newBuilder().autoBuild("eureka");
  b.setDataCenterInfo(info);
  return b;
}
修改Eureka实例ID(Changing the Eureka Instance ID)
A vanilla Netflix Eureka instance is registered with an ID that is equal to its host name (i.e. only one service per host). Spring Cloud Eureka provides a sensible default that looks like this: ${spring.cloud.client.hostname}:${spring.application.name}:${spring.application.instance_id:${server.port}}}. For example myhost:myappname:8080.
Netflix Eureka实例是一个身份证,等于其域名注册(即只有一个服务/主机)。Spring Cloud Eureka提供了合理的默认值,看起来像这样:${spring.cloud.client.hostname}:${spring.application.name}:${spring.application.instance_id:${server.port}}}。例如` Myhost:myappname:8080 `。
Using Spring Cloud you can override this by providing a unique identifier in eureka.instance.instanceId. For example:
使用Spring云可以通过eureka.instance.instanceId提供一个惟一的标识符覆盖它:
eureka:
  instance:
    instanceId: ${spring.application.name}:${vcap.application.instance_id:${spring.application.instance_id:${random.value}}}
With this metadata, and multiple service instances deployed on
localhost, the random value will kick in there to make the instance
unique. In Cloudfoundry the vcap.application.instance_id will be
populated automatically in a Spring Boot application, so the
random value will not be needed.
根据这种元数据,并且多个实例部署在localhost,随机值可以确保实例的唯一。但是在Cloudfoundry中,vcap.application.instance_id将被自动赋值在一个Spring Boot应用程序中,因此随机值将不再被需要。
使用EurekaClient(Using the EurekaClient)
Once you have an app that is @EnableDiscoveryClient (or @EnableEurekaClient) you can use it to
discover service instances from the Eureka Server. One way to do that is to use the native
com.netflix.discovery.EurekaClient (as opposed to the Spring
Cloud DiscoveryClient), e.g.
一旦你有一个应用是 @EnableDiscoveryClient (或 @EnableEurekaClient) 你使用它从 Eureka Server发现服务实例。其中一个方法是使用原生的
com.netflix.discovery.EurekaClient (而不是 Spring
Cloud的 DiscoveryClient), 例子:
@Autowired
private EurekaClient discoveryClient;

public String serviceUrl() {
    InstanceInfo instance = discoveryClient.getNextServerFromEureka("STORES", false);
    return instance.getHomePageUrl();
}
|
Don’t use the 不要在 |
代替原生的Netflix EurekaClient(Alternatives to the native Netflix EurekaClient)
You don’t have to use the raw Netflix EurekaClient and usually it
is more convenient to use it behind a wrapper of some sort. Spring
Cloud has support for Feign (a REST client
builder) and also Spring RestTemplate using
the logical Eureka service identifiers (VIPs) instead of physical
URLs. To configure Ribbon with a fixed list of physical servers you
can simply set <client>.ribbon.listOfServers to a comma-separated
list of physical addresses (or hostnames), where <client> is the ID
of the client.
你不一定要使用内存Netflix EurekaClient并且通常使用它背后的某种形式的封装是更方便的。
Spring Cloud已经支持Feign(一个REST客户端构建)并且Spring RestTemplate
也使用逻辑Eureka服务标识符(VIP)代替物理的URL。去配置一个固定物理服务器的列表的Ribbon,你可以对<client>是客户端的ID,用一个逗号分隔物理地址(或主机名)列表来简单地设置<client>.ribbon.listOfServers。
You can also use the org.springframework.cloud.client.discovery.DiscoveryClient
which provides a simple API for discovery clients that is not specific
to Netflix, e.g.
你也可以使用org.springframework.cloud.client.discovery.DiscoveryClient提供一个简单的API给不确定的Netflix发现客户端。
@Autowired
private DiscoveryClient discoveryClient;

public String serviceUrl() {
    List<ServiceInstance> list = discoveryClient.getInstances("STORES");
    if (list != null && list.size() > 0 ) {
        return list.get(0).getUri();
    }
    return null;
}
为什么注册一个服务这么慢? (Why is it so Slow to Register a Service?)
Being an instance also involves a periodic heartbeat to the registry
(via the client’s serviceUrl) with default duration 30 seconds. A
service is not available for discovery by clients until the instance,
the server and the client all have the same metadata in their local
cache (so it could take 3 heartbeats). You can change the period using
eureka.instance.leaseRenewalIntervalInSeconds and this will speed up
the process of getting clients connected to other services. In
production it’s probably better to stick with the default because
there are some computations internally in the server that make
assumptions about the lease renewal period.
作为一个实例向注册中心还包括一个默认持续30秒的周期心跳(通过客户的serviceUrl)。一个服务对于客户端的discovery不可用的,直到实例、服务端和客户端全都拥有相同的元数据在它们的缓存里面(这可能还需要3次心跳)。你可以改变使用eureka.instance.leaseRenewalIntervalInSeconds并且这将加快这一进程的客户端连接到其他服务。在实际生产中坚持默认可能是更好的,因为有一些在服务器内部计算对租赁复兴时期做出假设。
服务发现: Eureka Server(Service Discovery: Eureka Server)
Example eureka server (e.g. using spring-cloud-starter-eureka-server to set up the classpath):
例如 eureka 服务 (例子: 使用 spring-cloud-starter-eureka-server 去设置 classpath):
@SpringBootApplication
@EnableEurekaServer
public class Application {

    public static void main(String[] args) {
        new SpringApplicationBuilder(Application.class).web(true).run(args);
    }

}
The server has a home page with a UI, and HTTP API endpoints per the
normal Eureka functionality under /eureka/*.
服务端有一个带UI的首页并且HTTP API端点按正常的Eureka功能下的/eureka/*。
Eureka background reading: see flux capacitor and google group discussion.
Eureka 背景阅读: 请看 flux capacitor 和 google group discussion.
|
Due to Gradle’s dependency resolution rules and the lack of a parent bom feature, simply depending on spring-cloud-starter-eureka-server can cause failures on application startup. To remedy this the Spring Boot Gradle plugin must be added and the Spring cloud starter parent bom must be imported like so: 由于Gradle的依赖解析规则缺乏父依赖,单纯的依靠spring-cloud-starter-eureka-server会导致启动失败。为了填补这一缺陷,必须添加Spring Boot Gradle插件和导入Spring cloud starter的父依赖,如: build.gradle
|
高可用性(High Availability, Zones and Regions)
The Eureka server does not have a backend store, but the service instances in the registry all have to send heartbeats to keep their registrations up to date (so this can be done in memory). Clients also have an in-memory cache of eureka registrations (so they don’t have to go to the registry for every single request to a service).
Eureka服务端没有后台存储,但是服务实例在注册里面全都得发送心跳去保持注册更新(在内存里操作)客户端们也有一份内存缓存着eureka的注册信息(因此,他们不必表为每单一的请求注册到一个服务)。
By default every Eureka server is also a Eureka client and requires (at least one) service URL to locate a peer. If you don’t provide it the service will run and work, but it will shower your logs with a lot of noise about not being able to register with the peer.
默认情况下每个Eureka服务端也是一个Eureka客户端并且通过请求服务的URL去定位一个节点。如果你不提供的话,服务虽然还会运行和工作,但是它不会向你打印一堆关于没有注册的节点日志。
See also below for details of Ribbon support on the client side for Zones and Regions.
令请参阅 以下细节为 Ribbon 支持 在客户端区域和地区。
标准模式(Standalone Mode)
The combination of the two caches (client and server) and the heartbeats make a standalone Eureka server fairly resilient to failure, as long as there is some sort of monitor or elastic runtime keeping it alive (e.g. Cloud Foundry). In standalone mode, you might prefer to switch off the client side behaviour, so it doesn’t keep trying and failing to reach its peers. Example:
这两个缓存的组合(客户端和服务器)和心跳使一个标准模式的Eureka客户端弹性挂掉,只要有某种monitor或者elastic运行保持它活着。(如 Cloud Foundry)在标准模式,您可能更倾向于关闭客户端的行为,所以它不能保持失败重试和重新找回它的那些节点。如:
server:
  port: 8761

eureka:
  instance:
    hostname: localhost
  client:
    registerWithEureka: false
    fetchRegistry: false
    serviceUrl:
      defaultZone: http://${eureka.instance.hostname}:${server.port}/eureka/
Notice that the serviceUrl is pointing to the same host as the local
instance.
请注意,serviceUrl是指向同一个主机的本地实例。
节点感知(Peer Awareness)
Eureka can be made even more resilient and available by running
multiple instances and asking them to register with each other. In
fact, this is the default behaviour, so all you need to do to make it
work is add a valid serviceUrl to a peer, e.g.
Eureka甚至可以更有弹性和可用的运行多个实例,并让他们互相注册。事实上,这也是默认的行为,因此所有你需要让它工作的,只要添加一个有效的节点serviceUrl,例如:
---
spring:
  profiles: peer1
eureka:
  instance:
    hostname: peer1
  client:
    serviceUrl:
      defaultZone: http://peer2/eureka/

---
spring:
  profiles: peer2
eureka:
  instance:
    hostname: peer2
  client:
    serviceUrl:
      defaultZone: http://peer1/eureka/
In this example we have a YAML file that can be used to run the same
server on 2 hosts (peer1 and peer2), by running it in different
Spring profiles. You could use this configuration to test the peer
awareness on a single host (there’s not much value in doing that in
production) by manipulating /etc/hosts to resolve the host names. In
fact, the eureka.instance.hostname is not needed if you are running
on a machine that knows its own hostname (it is looked up using
java.net.InetAddress by default).
在这个例子,我们有一个YAML文件能够被使用去运行在两个主机运行相同的服务(peer1 和 peer2),在不同的Spring配置文件运行。你还可以使用这个配置在单个主机上去测试节点感知(在生产中这样做没有多少价值),通过操纵/etc/hosts来解决主机名称。事实上,如果你在一直已知主机名的机器声运行的话,eureka.instance.hostname是不需要的(默认查找使用的java.net.InetAddress)。
You can add multiple peers to a system, and as long as they are all connected to each other by at least one edge, they will synchronize the registrations amongst themselves. If the peers are physically separated (inside a data centre or between multiple data centres) then the system can in principle survive split-brain type failures.
你可以添加更多的节点进一个系统,并且只要他们全都互相能通过最少一边来互相连接,他们将同步互相注册他们自己。如果节点被分离(在一个数据中心或者多个数据中心之间)那么系统原则上split-brain类型存活失败。
IP偏好(Prefer IP Address)
In some cases, it is preferable for Eureka to advertise the IP Adresses
of services rather than the hostname. Set eureka.instance.preferIpAddress
to true and when the application registers with eureka, it will use its
IP Address rather than its hostname.
在一些案例里,更可取的是Eureka广播服务的IP地址而不是主机名。设置eureka.instance.preferIpAddress 为true以便当应用注册到eureka的湿乎乎,它将使用它的IP地址而不是主机名。
断路器(Circuit Breaker: Hystrix Clients)
Netflix has created a library called Hystrix that implements the circuit breaker pattern. In a microservice architecture it is common to have multiple layers of service calls.
Netflix意见创建了一个库叫 Hystrix 实现了 circuit breaker pattern。 在microservice架构中有多个层的服务调用。
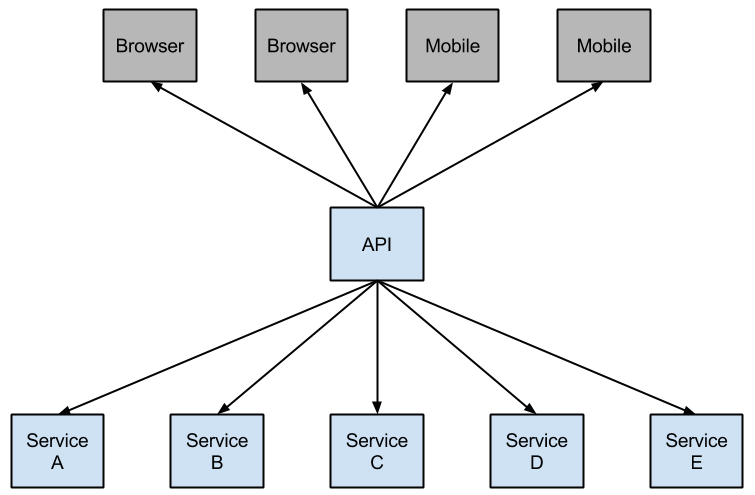
A service failure in the lower level of services can cause cascading failure all the way up to the user. When calls to a particular service reach a certain threshold (20 failures in 5 seconds is the default in Hystrix), the circuit opens and the call is not made. In cases of error and an open circuit a fallback can be provided by the developer.
一个低水平的服务群中一个服务挂掉会给用户导致级联失效的。当调用一个特定的服务达到一定阈值(在Hystrix里默认是5秒内20个失败),断路由开启并且调用没有成功的。开发人员能够提供错误原因和开启一个断路由回调。
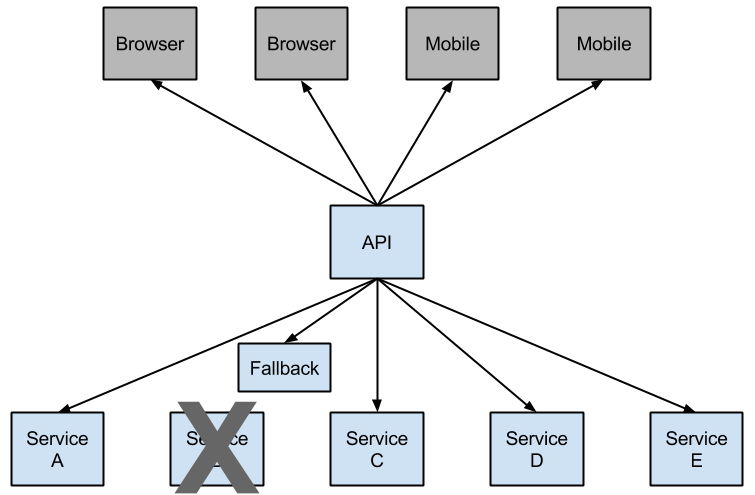
Having an open circuit stops cascading failures and allows overwhelmed or failing services time to heal. The fallback can be another Hystrix protected call, static data or a sane empty value. Fallbacks may be chained so the first fallback makes some other business call which in turn falls back to static data.
出现公开的电路停止连锁故障并且允许解决或者失败的服务时间来修复。回调能被另一个Hystrix保护调用,静态数据或者合理的空数据。回调 可以绑定因此第一次回调会有一些其它的业务调用反过来才落回到静态数据。
Example boot app:
启动应用示例:
@SpringBootApplication
@EnableCircuitBreaker
public class Application {

    public static void main(String[] args) {
        new SpringApplicationBuilder(Application.class).web(true).run(args);
    }

}

@Component
public class StoreIntegration {

    @HystrixCommand(fallbackMethod = "defaultStores")
    public Object getStores(Map<String, Object> parameters) {
        //do stuff that might fail
    }

    public Object defaultStores(Map<String, Object> parameters) {
        return /* something useful */;
    }
}
The @HystrixCommand is provided by a Netflix contrib library called
"javanica".
Spring Cloud automatically wraps Spring beans with that
annotation in a proxy that is connected to the Hystrix circuit
breaker. The circuit breaker calculates when to open and close the
circuit, and what to do in case of a failure.
Netflix路由库提供@HystrixCommand调用
"javanica".
Spring Cloud 在这个注解下自动包裹Spring beans进一个代理里面,被连接到了一个Hystrix断路由。断路器计算何时打开和关闭电路,并在失败的情况下做什么。
To configure the @HystrixCommand you can use the commandProperties
attribute with a list of @HystrixProperty annotations. See
here
for more details. See the Hystrix wiki
for details on the properties available.
你可以使用commandProperties参数和@HystrixProperty注解的集合来配置@HystrixCommand。请见
here
更多细节. 请见 the Hystrix wiki
有关可用的属性。
传播安全上下文或使用 Spring Scopes(Propagating the Security Context or using Spring Scopes)
If you want some thread local context to propagate into a @HystrixCommand the default declaration will not work because it executes the command in a thread pool (in case of timeouts). You can switch Hystrix to use the same thread as the caller using some configuration, or directly in the annotation, by asking it to use a different "Isolation Strategy". For example:
如果你想一些线程的本地的上下文传播到一个@HystrixCommand,默认声明将不会工作,因为他在线程池里执行命令。(在超时的情况下)。你可以切换Hystrix去使用同个线程让调用者使用一些配置,或直接在注解中,让它去使用不同的“隔离策略”。举例:
@HystrixCommand(fallbackMethod = "stubMyService",
    commandProperties = {
      @HystrixProperty(name="execution.isolation.strategy", value="SEMAPHORE")
    }
)
...
The same thing applies if you are using @SessionScope or @RequestScope. You will know when you need to do this because of a runtime exception that says it can’t find the scoped context.
如果你使用@SessionScope 或 @RequestScope同样适用。你会知道你要这么做,因为一个runtime异常说他不能找到作用域上下文。
健康指标(Health Indicator)
The state of the connected circuit breakers are also exposed in the
/health endpoint of the calling application.
连接的断路器的状态也暴露在呼叫应用程序的/health端点中。
{
    "hystrix": {
        "openCircuitBreakers": [
            "StoreIntegration::getStoresByLocationLink"
        ],
        "status": "CIRCUIT_OPEN"
    },
    "status": "UP"
}
Hystrix 指标流(Hystrix Metrics Stream)
To enable the Hystrix metrics stream include a dependency on spring-boot-starter-actuator. This will expose the /hystrix.stream as a management endpoint.
使Hystrix指标流包括依赖于spring-boot-starter-actuator。这将使/hystrix.stream流作为一个管理端点。
    <dependency>
        <groupId>org.springframework.boot</groupId>
        <artifactId>spring-boot-starter-actuator</artifactId>
    </dependency>
断路器: Hystrix 仪表盘(Circuit Breaker: Hystrix Dashboard)
One of the main benefits of Hystrix is the set of metrics it gathers about each HystrixCommand. The Hystrix Dashboard displays the health of each circuit breaker in an efficient manner.
Hystrix的主要作用是会采集每一个HystrixCommand的信息指标,把每一个断路器的信息指标显示的Hystrix仪表盘上。
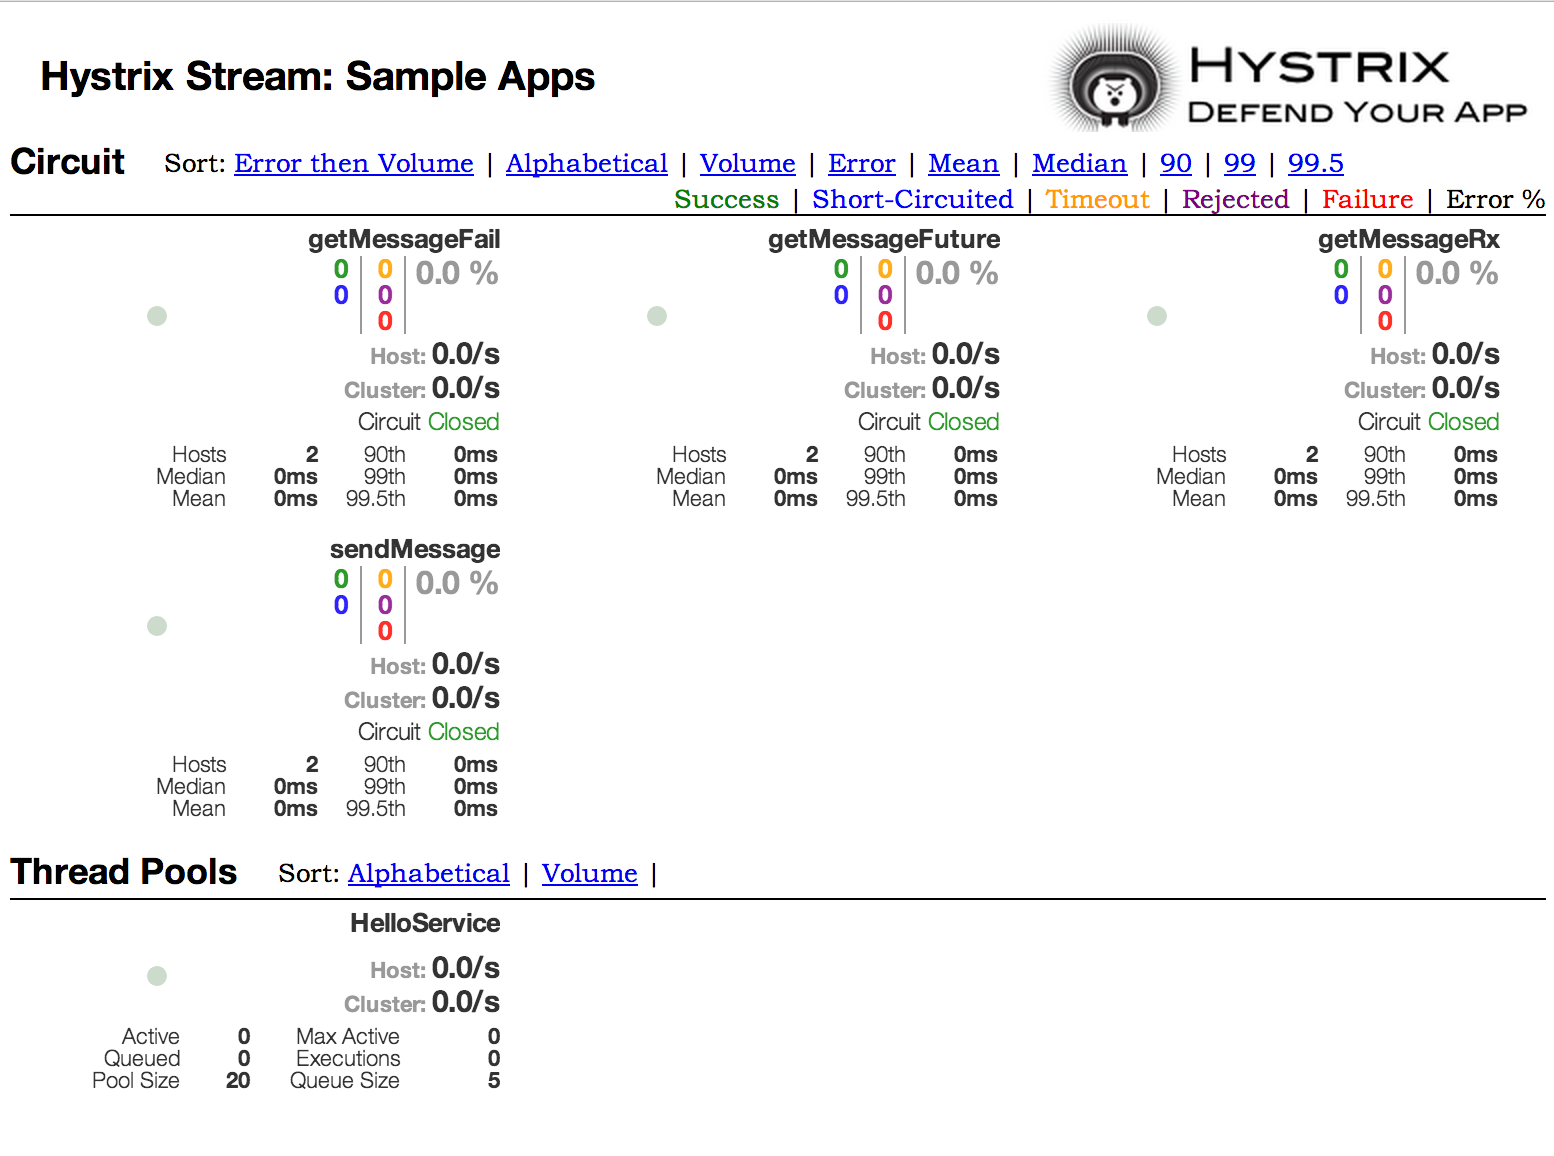
To run the Hystrix Dashboard annotate your Spring Boot main class with @EnableHystrixDashboard. You then visit /hystrix and point the dashboard to an individual instances /hystrix.stream endpoint in a Hystrix client application.
运行Hystrix仪表板需要在spring boot主类上标注@EnableHystrixDashboard。然后访问/hystrix查看仪表盘,在hystrix客户端应用使用/hystrix.stream监控。
Turbine
Looking at an individual instances Hystrix data is not very useful in terms of the overall health of the system. Turbine is an application that aggregates all of the relevant /hystrix.stream endpoints into a combined /turbine.stream for use in the Hystrix Dashboard. Individual instances are located via Eureka. Running Turbine is as simple as annotating your main class with the @EnableTurbine annotation (e.g. using spring-cloud-starter-turbine to set up the classpath). All of the documented configuration properties from the Turbine 1 wiki apply. The only difference is that the turbine.instanceUrlSuffix does not need the port prepended as this is handled automatically unless turbine.instanceInsertPort=false.
看一个实例Hystrix数据对于整个系统的健康不是很有用.
Turbine 是一个应用程序,该应用程序汇集了所有相关的/hystrix.stream端点到 /turbine.stream用于Hystrix仪表板。运行turbine使用@EnableTurbine注解你的主类,使用spring-cloud-starter-turbine这个jar。配置请参考
the Turbine 1 wiki
唯一的区别是turbine.instanceUrlSuffix不需要端口号前缀,因为这是自动处理,除非turbine.instanceInsertPort=false。
The configuration key turbine.appConfig is a list of eureka serviceIds that turbine will use to lookup instances. The turbine stream is then used in the Hystrix dashboard using a url that looks like: http://my.turbine.sever:8080/turbine.stream?cluster=<CLUSTERNAME>; (the cluster parameter can be omitted if the name is "default"). The cluster parameter must match an entry in turbine.aggregator.clusterConfig. Values returned from eureka are uppercase, thus we expect this example to work if there is an app registered with Eureka called "customers":
turbine.appConfig配置是一个eureka服务ID列表,turbine将使用这个配置查询实例。turbine stream在hystrix dashboard中使用如下的url配置:
http://my.turbine.server:8080/turbine.stream?cluster=<CLUSTERNAME>,如果集群的名称是default,集群参数可以忽略)。这个cluster参数必须和turbine.aggregator.clusterConfig匹配。从eureka返回的值都是大写的,因此我们希望下面的例子可以工作,如果一个app使用eureka注册,并且被叫做"customers":
turbine:
  aggregator:
    clusterConfig: CUSTOMERS
  appConfig: customers
The clusterName can be customized by a SPEL expression in turbine.clusterNameExpression with root an instance of InstanceInfo. The default value is appName, which means that the Eureka serviceId ends up as the cluster key (i.e. the InstanceInfo for customers has an appName of "CUSTOMERS"). A different example would be turbine.clusterNameExpression=aSGName, which would get the cluster name from the AWS ASG name. Another example:
clusterName可以使用SPEL表达式定义,在turbine.clusterNameExpression。
默认值是appName,意思是eureka服务ID最终将作为集群的key,例如customers的 InstanceInfo有一个CUSTOMERS的appName。另外一个例子是turbine.clusterNameExpression=aSGName,将从AWS ASG name获取集群名称。作者例子:
turbine:
  aggregator:
    clusterConfig: SYSTEM,USER
  appConfig: customers,stores,ui,admin
  clusterNameExpression: metadata['cluster']
In this case, the cluster name from 4 services is pulled from their metadata map, and is expected to have values that include "SYSTEM" and "USER".
在这种情况下,集群名称从4个服务从其元数据映射,期望包含“SYSTEM”和“USER”。
To use the "default" cluster for all apps you need a string literal expression (with single quotes, and escaped with double quotes if it is in YAML as well):
所有的app使用default,你需要一个文字表达式(使用单引号):
turbine:
  appConfig: customers,stores
  clusterNameExpression: "'default'"
Spring Cloud provides a spring-cloud-starter-turbine that has all the dependencies you need to get a Turbine server running. Just create a Spring Boot application and annotate it with @EnableTurbine.
spring cloud提供一个spring-cloud-starter-turbine,所有依赖项你需要运行一个turbine服务器。使用@EnableTurbine创建一个spring boot应用。
by default Spring Cloud allows Turbine to use the host and port to allow multiple processes per host, per cluster. If you want the native Netflix behaviour built into Turbine that does not allow multiple processes per host, per cluster (the key to the instance id is the hostname), then set the property turbine.combineHostPort=false.
|
默认情况下Spring Cloud 允许 Turbine 在集群的每个主机下使用主机名和端口运行多个进程。如果你想在集群中的每个主机使用本机原生Netfix行为且不允许多个进程创建运行Turbine。(实例id的key为主机名)然后设置属性turbine.combineHostPort=false
|
Turbine Stream
In some environments (e.g. in a PaaS setting), the classic Turbine model of pulling metrics from all the distributed Hystrix commands doesn’t work. In that case you might want to have your Hystrix commands push metrics to Turbine, and Spring Cloud enables that with messaging. All you need to do on the client is add a dependency to spring-cloud-netflix-hystrix-stream and the spring-cloud-starter-stream-* of your choice (see Spring Cloud Stream documentation for details on the brokers, and how to configure the client credentials, but it should work out of the box for a local broker).
在一些环境(Pass), 在所有分布式下典型的Turbine 模型的Hystrix 命令都不工作,在这种情况下,你可能想要 Hystrix 命令 推送到 Tuibine, 和Spring Cloud进行消息传递,那么你需要要做的是在客户端添加一个依赖spring-cloud-netflix-hystrix-stream和你所选择的 spring-cloud-starter-stream-*的依赖(相关信息请查看 Spring Cloud Stream 方档,以及如何配置客户端凭证,和工作时的要本地代理)
On the server side Just create a Spring Boot application and annotate it with @EnableTurbineStream and by default it will come up on port 8989 (point your Hystrix dashboard to that port, any path). You can customize the port using either server.port or turbine.stream.port. If you have spring-boot-starter-web and spring-boot-starter-actuator on the classpath as well, then you can open up the Actuator endpoints on a separate port (with Tomcat by default) by providing a management.port which is different.
创建一个带有注解 @EnableTurbineStream 的Spring boot 应用服务器,端口默认 8989 (Hystrix 仪表盘的URL都使用此端口), 如果你想自定义端口,可以配置 server.port
或 turbine.stream.port 任一个,如果你使用了
spring-boot-starter-web 和 spring-boot-starter-actuator ,那么你可以提供(使用Tomcat默认情况下) management.port 不同的端口,并打开这个单独的执行器端口
You can then point the Hystrix Dashboard to the Turbine Stream Server instead of individual Hystrix streams. If Turbine Stream is running on port 8989 on myhost, then put http://myhost:8989 in the stream input field in the Hystrix Dashboard. Circuits will be prefixed by their respective serviceId, followed by a dot, then the circuit name.
你可以把Dashboard指向Turbine Stream Server来代替个别Hystrix streams。如果Tubine Stream 使用你本机的8989端口运行,然后把 http://myhost:8989在流输入字段Hystrix仪表板 Circuits 将由各自的 serverId关缀,紧随其后的是一个点,然后是circuit 名称
Spring Cloud provides a spring-cloud-starter-turbine-stream that has all the dependencies you need to get a Turbine Stream server running - just add the Stream binder of your choice, e.g. spring-cloud-starter-stream-rabbit. You need Java 8 to run the app because it is Netty-based.
Spring Cloud提供了一个 spring-cloud-starter-turbine-stream,包括了运行 Turibine Stream Server运行所需要的所有依赖,如spring-cloud-starter-stream-rabbit. 因为使用了Netty-based,所以你需要Java 8 运行此应用
客户端负载均衡器(Client Side Load Balancer: Ribbon)
Ribbon is a client side load balancer which gives you a lot of control
over the behaviour of HTTP and TCP clients. Feign already uses Ribbon,
so if you are using @FeignClient then this section also applies.
Ribbon 是一个客户端负载均衡器,给了你很多控制
HTTP 和 TCP 客户端的行为,假装已经使用了 Ribbon,
如果您使用的是@FeignClient那么这一节还适用。
A central concept in Ribbon is that of the named client. Each load
balancer is part of an ensemble of components that work together to
contact a remote server on demand, and the ensemble has a name that
you give it as an application developer (e.g. using the @FeignClient
annotation). Spring Cloud creates a new ensemble as an
ApplicationContext on demand for each named client using
RibbonClientConfiguration. This contains (amongst other things) an
ILoadBalancer, a RestClient, and a ServerListFilter.
在Ribbon一个核心概念是命名的客户端.每个负载
平衡器是共同组件的集合的一部分,通过远程服务器联系, 你把它作为应用程序开发者(例如,使用 @FeignClient注解)的名称,Spring Cloud创建一个新的整体使用RibbonClientConfiguration为每一个客户端命名的 ApplicationContext,这包含(除其他事项外)的ILoadBalancer,一个RestClient 实现和ServerListFilter。
自定义Ribbon客户端(Customizing the Ribbon Client)
You can configure some bits of a Ribbon client using external
properties in <client>.ribbon.*, which is no different than using
the Netflix APIs natively, except that you can use Spring Boot
configuration files. The native options can
be inspected as static fields in CommonClientConfigKey (part of
ribbon-core).
你可以配置Ribbon客户端扩展属性 <client>.ribbon.*,它只不过是利用了不同的原生Netflix APIS, 但你可以使用 Spring Boot 配置文件, 原生选项检查的静态属性在 CommonClientConfigKey(部分为ribbon-core)
Spring Cloud also lets you take full control of the client by
declaring additional configuration (on top of the
RibbonClientConfiguration) using @RibbonClient. Example:
Spring clound 使用额外的配置(RibbonClientConfiguration)可以让你充分控制客户端,
使用@RibbonClient. 例子:
@Configuration
@RibbonClient(name = "foo", configuration = FooConfiguration.class)
public class TestConfiguration {
}
In this case the client is composed from the components already in
RibbonClientConfiguration together with any in FooConfiguration
(where the latter generally will override the former).
在这种情况下客户端组件由 RibbonClientConfiguration 和一些 FooConfiguration组成
(通常后者会覆盖前者)
The FooConfiguration has to be @Configuration but take
care that it is not in a @ComponentScan for the main application
context, otherwise it will be shared by all the @RibbonClients. If
you use @ComponentScan (or @SpringBootApplication) you need to
take steps to avoid it being included (for instance put it in a
separate, non-overlapping package, or specify the packages to scan
explicitly in the @ComponentScan).
|
FooConfiguration 必须有 @Configuration,而不是由主应用程序@ComponentScan收集,其他情况下会被 @RibbonClients共享,如果你使用@ComponentScan或@SpringBootApplication,那么你应放入单独的,非同名的包下或明确@ComponentScan扫描的指定包。
|
Spring Cloud Netflix provides the following beans by default for ribbon
(BeanType beanName: ClassName):
Spring Cloud Netflix ribbon默认提供了以下beans (BeanType beanName: ClassName):
-
IClientConfigribbonClientConfig:DefaultClientConfigImpl -
IRuleribbonRule:ZoneAvoidanceRule -
IPingribbonPing:NoOpPing -
ServerList<Server>ribbonServerList:ConfigurationBasedServerList -
ServerListFilter<Server>ribbonServerListFilter:ZonePreferenceServerListFilter -
ILoadBalancerribbonLoadBalancer:ZoneAwareLoadBalancer
Creating a bean of one of those type and placing it in a @RibbonClient
configuration (such as FooConfiguration above) allows you to override each
one of the beans described. Example:
创建一个bean来自其中一个类型,并把它放在一个@RibbonClient的配置(比如上面的FooConfiguration ), 允许你覆盖一个描述的Bean. 例:
@Configuration
public class FooConfiguration {
    @Bean
    public IPing ribbonPing(IClientConfig config) {
        return new PingUrl();
    }
}
This replaces the NoOpPing with PingUrl.
这里用PingUrl替换NoOpPing.
在Eureka中使用Ribbon(Using Ribbon with Eureka)
When Eureka is used in conjunction with Ribbon the ribbonServerList
is overridden with an extension of DiscoveryEnabledNIWSServerList
which populates the list of servers from Eureka. It also replaces the
IPing interface with NIWSDiscoveryPing which delegates to Eureka
to determine if a server is up. The ServerList that is installed by
default is a DomainExtractingServerList and the purpose of this is
to make physical metadata available to the load balancer without using
AWS AMI metadata (which is what Netflix relies on). By default the
server list will be constructed with "zone" information as provided in
the instance metadata (so on the remote clients set
eureka.instance.metadataMap.zone), and if that is missing it can use
the domain name from the server hostname as a proxy for zone (if the
flag approximateZoneFromHostname is set). Once the zone information
is available it can be used in a ServerListFilter. By default it
will be used to locate a server in the same zone as the client because
the default is a ZonePreferenceServerListFilter. The zone of the
client is determined the same way as the remote instances by default,
i.e. via eureka.instance.metadataMap.zone.
当 Eureka 和 Ribbon 的 ribbonServerList 一起使用来自Eureka中被覆盖且扩展的 DiscoveryEnabledNIWSServerList服务器列表,它用IPing接口 和 NIWSDiscoveryPing 委托给Eureka来确保服务器是否启动,安装在ServerList缺省值为 DiscoveryEnabledNIWSServerList
这样的目的是使用物理元数据提供给负载均衡器,而无需使用AWS AMI元数据(这是Netflix的依赖),默认情况下,服务器列表将由“区域”中提供的信息实例元数据(远程客户端设置eureka.instance.metadataMap.zone),如果缺少它可以使用从服务器主机名作为区域代理的域名(如标志approximateZoneFromHostname设置)。一旦该区域信息可用它可以在一个ServerListFilter使用。默认情况下,将被使用在同一区域定位服务器作为客户端,因为默认是ZonePreferenceServerListFilter。的区域客户被确定相同的方式由缺省远程实例即通过eureka.instance.metadataMap.zone。
| The orthodox "archaius" way to set the client zone is via a configuration property called "@zone", and Spring Cloud will use that in preference to all other settings if it is available (note that the key will have to be quoted in YAML configuration). |
NOTE:规范的 "archaius" 方式去设置客户端区,可以使用配置属性"@zone", Spring Cloud 将优先于所有的其他设置(注意:该重点将在 YAML 配置被引用)
If there is no other source of zone data then a guess is made
based on the client configuration (as opposed to the instance
configuration). We take eureka.client.availabilityZones, which is a
map from region name to a list of zones, and pull out the first zone
for the instance’s own region (i.e. the eureka.client.region, which
defaults to "us-east-1" for comatibility with native Netflix).
|
NOTE:如果没有其他来源的区域数据则由基于客户机的配置(而不是实例配置).我们把 eureka.client.availabilityZones, 这是一个从区域名称映射到区域的列表,并拿出第一个区为实例自己的区域(即eureka.client.region, 默认为"us-east-1" 与 原生的Netflix comatibility)
示例: 没有Eureka时如何使用Ribbon(Example: How to Use Ribbon Without Eureka)
Eureka is a convenient way to abstract the discovery of remote servers
so you don’t have to hard code their URLs in clients, but if you
prefer not to use it, Ribbon and Feign are still quite
amenable. Suppose you have declared a @RibbonClient for "stores",
and Eureka is not in use (and not even on the classpath). The Ribbon
client defaults to a configured server list, and you can supply the
configuration like this
Eureka 是一种很方便的抽象方式去发现远程服务器,所以你不需要硬编码他们的客户端URL,但如果你不喜欢使用它,Ribbon 和 Feign 仍然经得起检验,假设你已经声明了 @RibbonClient 为 "stores", 与 Eureka 是不使用(甚至不能在类路径). Ribbon 客户端默认配置的服务器列,并且可以提供这样的配置
stores:
  ribbon:
    listOfServers: example.com,google.com
示例:禁用Eureka使用Ribbon(Example: Disable Eureka use in Ribbon)
Setting the property ribbon.eureka.enabled = false will explicitly
disable the use of Eureka in Ribbon.
设置属性ribbon.eureka.enabled = false, 使用Ribbon时禁用Eureka
ribbon:
  eureka:
   enabled: false
直接使用Ribbon的API(Using the Ribbon API Directly)
You can also use the LoadBalancerClient directly. Example:
你也可以直接使用 LoadBalancerClient,例子:
public class MyClass {
    @Autowired
    private LoadBalancerClient loadBalancer;

    public void doStuff() {
        ServiceInstance instance = loadBalancer.choose("stores");
        URI storesUri = URI.create(String.format("http://%s:%s", instance.getHost(), instance.getPort()));
        // ... do something with the URI
    }
}
声明REST Client:Feign(Declarative REST Client: Feign)
Feign is a declarative web service client. It makes writing web service clients easier. To use Feign create an interface and annotate it. It has pluggable annotation support including Feign annotations and JAX-RS annotations. Feign also supports pluggable encoders and decoders. Spring Cloud adds support for Spring MVC annotations and for using the same HttpMessageConverters used by default in Spring Web. Spring Cloud integrates Ribbon and Eureka to provide a load balanced http client when using Feign.
Feign 是一个声明web服务客户端,这便得编写web服务客户端更容易,使用Feign 创建一个接口并对它进行注解,它具有可插拔的注解支持包括Feign注解与JAX-RS注解,Feign还支持可插拔的编码器与解码器,Spring Cloud 增加了对 Spring MVC的注解,Spring Web 默认使用了HttpMessageConverters, Spring Cloud 集成 Ribbon 和 Eureka 提供的负载均衡的HTTP客户端 Feign.
Example spring boot app
@Configuration
@ComponentScan
@EnableAutoConfiguration
@EnableEurekaClient
@EnableFeignClients
public class Application {

    public static void main(String[] args) {
        SpringApplication.run(Application.class, args);
    }

}@FeignClient("stores")
public interface StoreClient {
@RequestMapping(method = RequestMethod.GET, value = "/stores")
List<Store> getStores();
@RequestMapping(method = RequestMethod.POST, value = "/stores/{storeId}", consumes = "application/json")
Store update(@PathVariable("storeId") Long storeId, Store store);
}In the @FeignClient annotation the String value ("stores" above) is
an arbitrary client name, which is used to create a Ribbon load
balancer (see below for details of Ribbon
support). You can also specify a URL using the url attribute
(absolute value or just a hostname). The name of the bean in the application context is the fully qualified name of the interface. An alias is also created which is the 'name' attribute plus 'FeignClient'. For the example above, @Qualifier("storesFeignClient") could be used to reference the bean.
在“@FeignClient”注解字符串值(上边的“stores”)是任意客户端名称,用于创建一个带负载均衡器(see< < spring-cloud-ribbon,支持> >)。您还可以指定一个URL使用的URL属性(绝对值或只是一个主机名)。应用程序上下文中的bean的名称是接口的完全有资格的名称。还创建一个别名就是“名称”属性加上“FeignClient”。在上面的示例中,“@qualifier(“storesFeignClient”)“可以用来指示bean。
The Ribbon client above will want to discover the physical addresses for the "stores" service. If your application is a Eureka client then it will resolve the service in the Eureka service registry. If you don’t want to use Eureka, you can simply configure a list of servers in your external configuration (see above for example).
Ribbon Client 想要发现上边提到 "stores" 服务的物理地址, 如果你的应用程序是 Eureka client的 则将在 Eureka 服务仓库里解决服务的注册, 如果你不想用Eureka, 你可以简单配置服务列表above for example).
覆盖Feign默认(Overriding Feign Defaults)
A central concept in Spring Cloud’s Feign support is that of the named client. Each feign client is part of an ensemble of components that work together to contact a remote server on demand, and the ensemble has a name that you give it as an application developer using the @FeignClient annotation. Spring Cloud creates a new ensemble as an
ApplicationContext on demand for each named client using FeignClientsConfiguration. This contains (amongst other things) an feign.Decoder, a feign.Encoder, and a feign.Contract.
在Spring Cloud’s 的Feign支持的一个核心概念是命名的客户端.每个feign客户端是共同组件的集合的一部分,通过远程服务器联系, 你把它作为应用程序开发者(例如,使用 @FeignClient注解)的名称,Spring Cloud创建一个新的整体使用FeignClientsConfiguration为每一个客户端命名的 ApplicationContext,这包含(除其他事项外)的feign.Decoder,一个feign.Encoder 和feign.Contract。
Spring Cloud lets you take full control of the feign client by declaring additional configuration (on top of the FeignClientsConfiguration) using @FeignClient. Example:
Spring Cloud 可以在@FeignClient使用额外的配置(在FeignClientsConfiguration)完全控制feign客户端,例:
@FeignClient(name = "stores", configuration = FooConfiguration.class)
public interface StoreClient {
    //..
}
In this case the client is composed from the components already in FeignClientsConfiguration together with any in FooConfiguration (where the latter will override the former).
在这种情况下,客户端是由组件已经在FeignClientsConfiguration连同任何FeignClientsConfiguration(后者将会覆盖前者)。
The FooConfiguration has to be @Configuration but take care that it is not in a @ComponentScan for the main application context, otherwise it will be used for every @FeignClient. If you use @ComponentScan (or @SpringBootApplication) you need to take steps to avoid it being included (for instance put it in a separate, non-overlapping package, or specify the packages to scan explicitly in the @ComponentScan).
|
WARNING:FooConfiguration必须是@ Configuration但照顾它不是在@ ComponentScan为主要应用程序上下文,否则将被用于每个@ FeignClient。如果你使用@ComponentScan(或@ SpringBootApplication),你需要采取一些措施来避免它被列入(比如把它放在一个单独的,非重叠的包,或者指定包在@ComponentScan明确扫描)。
The serviceId attribute is now deprecated in favor of the name attribute.
|
该 serviceId 已经过时,建议使用 name 属性
|
Previously, using the url attribute, did not require the name attribute. Using name is now required.
|
以前,使用 url 属性,则 name 不是必须的,但现在是必须的.
|
Placeholders are supported in the name and url attributes.
占位符支持 name 和 url 属性.
@FeignClient(name = "${feign.name}", url = "${feign.url}")
public interface StoreClient {
    //..
}
Spring Cloud Netflix provides the following beans by default for feign (BeanType beanName: ClassName):
Spring Cloud Neflix Feign 默认提供了以下 Bean (BeanType beanName: ClassName):
-
DecoderfeignDecoder:ResponseEntityDecoder(which wraps aSpringDecoder) -
EncoderfeignEncoder:SpringEncoder -
LoggerfeignLogger:Slf4jLogger -
ContractfeignContract:SpringMvcContract -
Feign.BuilderfeignBuilder:HystrixFeign.Builder
Spring Cloud Netflix does not provide the following beans by default for feign, but still looks up beans of these types from the application context to create the feign client:
Spring Coud Netflix Feign 默认不提以下Bean, 但仍可以从应用的上下文中查找以下类型创建 Feign 客户端.
-
Logger.Level -
Retryer -
ErrorDecoder -
Request.Options -
Collection<RequestInterceptor>
Creating a bean of one of those type and placing it in a @FeignClient configuration (such as FooConfiguration above) allows you to override each one of the beans described. Example:
创建这些类型的一个bean可以放在@FeignClient配置中(如上FooConfiguration),允许你覆盖所描述的每一个bean. 例 子:
@Configuration
public class FooConfiguration {
    @Bean
    public Contract feignContract() {
        return new feign.Contract.Default();
    }

    @Bean
    public BasicAuthRequestInterceptor basicAuthRequestInterceptor() {
        return new BasicAuthRequestInterceptor("user", "password");
    }
}
This replaces the SpringMvcContract with feign.Contract.Default and adds a RequestInterceptor to the collection of RequestInterceptor.
可以替换SpringMvcContract 和 feign.Contract.Default, 并增加一个 RequestInterceptor 到 RequestInterceptor 中去.
Default configurations can be specified in the @EnableFeignClients attribute defaultConfiguration in a similar manner as described above. The difference is that this configuration will apply to all feign clients.
默认配置可在 @EnableFeignClients 属性, defaultConfiguration 通过类似的方式与上述被指定,不同的是,该结构将适用于 所有的 Feign 客户端.
Feign Hystrix Support
If Hystrix is on the classpath, by default Feign will wrap all methods with a circuit breaker. Returning a com.netflix.hystrix.HystrixCommand is also available. This lets you use reactive patterns (with a call to .toObservable() or .observe() or asynchronous use (with a call to .queue()).
如果 Hystrix 在 classPath下, 默认情况下 将包括 Feign 与 断路器所有的方法。 返回一个 com.netflix.hystrix.HystrixCommand 去使用,允许您使用反应模式 ( 调用.toObservable() 或 .observe() 或异步使用 ( .queue()).
To disable Hystrix support for Feign, set feign.hystrix.enabled=false.
要禁用Feign 的 Hystrix支持,设置feign.hystrix.enabled=false.
To disable Hystrix support on a per-client basis create a vanilla Feign.Builder with the "prototype" scope, e.g.:
要在每个客户端上禁用 Hystrix 支持,创建一个 Feign.Builder 并将scope 设置为"prototype",例如:
@Configuration
public class FooConfiguration {
    @Bean
	@Scope("prototype")
	public Feign.Builder feignBuilder() {
		return Feign.builder();
	}
}
Feign Hystrix Fallbacks
Hystrix supports the notion of a fallback: a default code path that is executed when they circuit is open or there is an error. To enable fallbacks for a given @FeignClient set the fallback attribute to the class name that implements the fallback.
Hystrix 支持回退的概念, 当线路打开有错误时则执行默认代码路径, 要启用回退要给@FeignClient设置fallback属性来实现回退的类名.
@FeignClient(name = "hello", fallback = HystrixClientFallback.class)
protected interface HystrixClient {
    @RequestMapping(method = RequestMethod.GET, value = "/hello")
    Hello iFailSometimes();
}

static class HystrixClientFallback implements HystrixClient {
    @Override
    public Hello iFailSometimes() {
        return new Hello("fallback");
    }
}
There is a limitation with the implementation of fallbacks in Feign and how Hystrix fallbacks work. Fallbacks are currently not supported for methods that return com.netflix.hystrix.HystrixCommand and rx.Observable.
|
有一个局限性,Feign的回退实现与Hystrix的回退一起工作, Fallbacks 目前不支持返回com.netflix.hystrix.HystrixCommand and rx.Observable的方法
|
Feign Inheritance Support
Feign supports boilerplate apis via single-inheritance interfaces. This allows grouping common operations into convenient base interfaces.
Feign 支持通过单继承接口样板的API。 这使得分组常见的操作方便的进入基本接口.
public interface UserService {

    @RequestMapping(method = RequestMethod.GET, value ="/users/{id}")
    User getUser(@PathVariable("id") long id);
}@RestController
public class UserResource implements UserService {
}package project.user;
@FeignClient("users")
public interface UserClient extends UserService {
}| It is generally not advisable to share an interface between a server and a client. It introduces tight coupling, and also actually doesn’t work with Spring MVC in its current form (method parameter mapping is not inherited). |
| 它通常是不可取的共享服务器和客户机之间的接口。它引入了紧耦合,也其实并不在其目前的形式与Spring MVC的工作(方法参数映射不继承)。 |
Feign 请求/响应 压缩(Feign request/response compression)
You may consider enabling the request or response GZIP compression for your Feign requests. You can do this by enabling one of the properties:
你可考虑启用请求或响应的 GZIP 压缩 Feign 的请求, 你可以通过启用一个属性做到这一点:
feign.compression.request.enabled=true
feign.compression.response.enabled=true
Feign request compression gives you settings similar to what you may set for your web server:
Feign 请求压缩设置和您的web服务器请求压缩设置类似。
feign.compression.request.enabled=true
feign.compression.request.mime-types=text/xml,application/xml,application/json
feign.compression.request.min-request-size=2048
These properties allow you to be selective about the compressed media types and minimum request threshold length.
用这些属性可以有选择性的对压缩介质和最低要求的阈值。
Feign logging
A logger is created for each Feign client created. By default the name of the logger is the full class name of the interface used to create the Feign client. Feign logging only responds to the DEBUG level.
日志是为每个创建Feign客户端创建, 默认的日志名称是用于创建Feign客户端接口的完整类名,Feign日志只响应 DEBUG 级别。
logging.level.project.user.UserClient: DEBUGThe Logger.Level object that you may configure per client, tells Feign how much to log. Choices are:
你能为每个客户端配置Logger.Level 对象,记录许多的日志,选项包括:
-
NONE, No logging (DEFAULT). -
BASIC, Log only the request method and URL and the response status code and execution time. -
HEADERS, Log the basic information along with request and response headers. -
FULL, Log the headers, body, and metadata for both requests and responses. -
NONE, 不记录 (DEFAULT). -
BASIC, 仅记录请求方式和URL及响应的状态代码与执行时间. -
HEADERS, 日志的基本信息与请求及响应的头. -
FULL, 记录请求与响应的头和正文及元数据.
For example, the following would set the Logger.Level to FULL:
例如:以下设置Logger.Level 为 FULL:
@Configuration
public class FooConfiguration {
    @Bean
    Logger.Level feignLoggerLevel() {
        return Logger.Level.FULL;
    }
}
外部配置: Archaius(External Configuration: Archaius)
Archaius is the Netflix client side configuration library. It is the library used by all of the Netflix OSS components for configuration. Archaius is an extension of the Apache Commons Configuration project. It allows updates to configuration by either polling a source for changes or for a source to push changes to the client. Archaius uses Dynamic<Type>Property classes as handles to properties.
class ArchaiusTest {
    DynamicStringProperty myprop = DynamicPropertyFactory
            .getInstance()
            .getStringProperty("my.prop");

    void doSomething() {
        OtherClass.someMethod(myprop.get());
    }
}
Archaius has its own set of configuration files and loading priorities. Spring applications should generally not use Archaius directly, but the need to configure the Netflix tools natively remains. Spring Cloud has a Spring Environment Bridge so Archaius can read properties from the Spring Environment. This allows Spring Boot projects to use the normal configuration toolchain, while allowing them to configure the Netflix tools, for the most part, as documented.
Archaius有它自己的一套配置文件和负载优先级, Spring 应用程序通常不应直接应用Archaius, 本身仍然有配置Netflix工具的需求, Spring Cloud 环境以桥接方式让Archaius要以阅读Spring 的环境属性, 在大多数情况下,这允许 Spring boot项目中使用正常的配置工具链,同时让他们配置Netflix工具,作为记录
路由和过滤器:Zuul(Router and Filter: Zuul)
Routing in an integral part of a microservice architecture. For example, / may be mapped to your web application, /api/users is mapped to the user service and /api/shop is mapped to the shop service. Zuul is a JVM based router and server side load balancer by Netflix.
路由是微服务架构中不可或缺的一部分。比如,/ 可能需要映射到你的web应用, /api/users 映射到用户服务, /api/shop 映射到商城服务. Zuul是Netflix出品的一个基于JVM路由和服务端的负载均衡器。
Netflix uses Zuul for the following:
-
Authentication
-
Insights
-
Stress Testing
-
Canary Testing
-
Dynamic Routing
-
Service Migration
-
Load Shedding
-
Security
-
Static Response handling
-
Active/Active traffic management
-
认证
-
Insights
-
压力测试
-
金丝雀测试
-
动态路由
-
服务迁移
-
负载削减
-
安全
-
静态响应处理
-
主动/主动交换管理
Zuul’s rule engine allows rules and filters to be written in essentially any JVM language, with built in support for Java and Groovy.
Zuul的规则引擎允许通过任何JVM语言来编写规则和过滤器, 支持基于Java和Groovy的构建。
The configuration property zuul.max.host.connections has been replaced by two new properties, zuul.host.maxTotalConnections and zuul.host.maxPerRouteConnections which default to 200 and 20 respectively.
|
配置属性 zuul.max.host.connections 已经被两个新的配置属性替代, zuul.host.maxTotalConnections 和 zuul.host.maxPerRouteConnections, 默认值分别是200和20.
|
嵌入Zuul反向代理(Embedded Zuul Reverse Proxy)
Spring Cloud has created an embedded Zuul proxy to ease the development of a very common use case where a UI application wants to proxy calls to one or more back end services. This feature is useful for a user interface to proxy to the backend services it requires, avoiding the need to manage CORS and authentication concerns independently for all the backends.
Spring Cloud创建了一个嵌入式Zuul代理来缓和急需一个UI应用程序来代理调用一个或多个后端服务的通用需求, 这个功能对于代理前端需要访问的后端服务非常有用, 避免了所有后端服务需要关心管理CORS和认证的问题.
To enable it, annotate a Spring Boot main class with
@EnableZuulProxy, and this forwards local calls to the appropriate
service. By convention, a service with the ID "users", will
receive requests from the proxy located at /users (with the prefix
stripped). The proxy uses Ribbon to locate an instance to forward to
via discovery, and all requests are executed in a hystrix command, so
failures will show up in Hystrix metrics, and once the circuit is open
the proxy will not try to contact the service.
在Spring Boot主函数上通过注解 @EnableZuulProxy 来开启, 这样可以让本地的请求转发到适当的服务. 按照约定, 一个ID为"users"的服务会收到 /users 请求路径的代理请求(前缀会被剥离).
Zuul使用Ribbon定位服务注册中的实例, 并且所有的请求都在hystrix的command中执行, 所以失败信息将会展现在Hystrix metrics中, 并且一旦断路器打开, 代理请求将不会尝试去链接服务.
| the Zuul starter does not include a discovery client, so for routes based on service IDs you need to provide one of those on the classpath as well (e.g. Eureka is one choice). |
| Zuul starter没有包含服务发现的客户端, 所以对于路由你需要在classpath中提供一个根据service IDs做服务发现的服务.(例如, eureka是一个不错的选择) |
To skip having a service automatically added, set
zuul.ignored-services to a list of service id patterns. If a service
matches a pattern that is ignored, but also included in the explicitly
configured routes map, then it will be unignored. Example:
在服务ID表达式列表中设置 zuul.ignored-services, 可以忽略已经添加的服务. 如果一个服务匹配表达式, 则将会被忽略, 但是对于明确配置在路由匹配中的, 将不会被忽略, 例如:
 zuul:
  ignoredServices: '*'
  routes:
    users: /myusers/**
In this example, all services are ignored except "users".
在这个例子中, 除了"users", 其他所有服务都被忽略了.
To augment or change the proxy routes, you can add external configuration like the following:
增加或改变代理路由, 你可以添加类似下面的外部配置:
 zuul:
  routes:
    users: /myusers/**
This means that http calls to "/myusers" get forwarded to the "users" service (for example "/myusers/101" is forwarded to "/101").
这个意味着http请求"/myusers"将被转发到"users"服务(比如 "/myusers/101" 将跳转到 "/101")
To get more fine-grained control over a route you can specify the path and the serviceId independently:
为了更细致的控制一个路由, 你可以直接配置路径和服务ID:
 zuul:
  routes:
    users:
      path: /myusers/**
      serviceId: users_service
This means that http calls to "/myusers" get forwarded to the "users_service" service. The route has to have a "path" which can be specified as an ant-style pattern, so "/myusers/*" only matches one level, but "/myusers/**" matches hierarchically.
这个意味着HTTP调用"/myusers"被转发到"users_service"服务. 路由必须配置一个可以被指定为ant风格表达式的"path", 所以“/myusers/*”只能匹配一个层级, 但"/myusers/**"可以匹配多级.
The location of the backend can be specified as either a "serviceId" (for a service from discovery) or a "url" (for a physical location), e.g.
后端的配置既可以是"serviceId"(对于服务发现中的服务而言), 也可以是"url"(对于物理地址), 例如:
 zuul:
  routes:
    users:
      path: /myusers/**
      url: http://example.com/users_service
These simple url-routes don’t get executed as a HystrixCommand nor can you loadbalance multiple URLs with Ribbon.
To achieve this, specify a service-route and configure a Ribbon client for the
serviceId (this currently requires disabling Eureka support in Ribbon:
see above for more information), e.g.
这个简单的"url-routes"不会按照 HystrixCommand 执行, 也无法通过Ribbon负载均衡多个URLs. 为了实现这一指定服务路由和配置Ribbon客户端(这个必须在Ribbon中禁用Eureka: 具体参考更多信息), 例如:
zuul:
  routes:
    users:
      path: /myusers/**
      serviceId: users

ribbon:
  eureka:
    enabled: false

users:
  ribbon:
    listOfServers: example.com,google.com
You can provide convention between serviceId and routes using regexmapper. It uses regular expression named groups to extract variables from serviceId and inject them into a route pattern.
你可以使用regexmapper提供serviceId和routes之间的绑定. 它使用正则表达式组来从serviceId提取变量, 然后注入到路由表达式中.
@Bean
public PatternServiceRouteMapper serviceRouteMapper() {
    return new PatternServiceRouteMapper(
        "(?<name>^.+)-(?<version>v.+$)",
        "${version}/${name}");
}
This means that a serviceId "myusers-v1" will be mapped to route "/v1/myusers/**". Any regular expression is accepted but all named groups must be present in both servicePattern and routePattern. If servicePattern does not match a serviceId, the default behavior is used. In the example above, a serviceId "myusers" will be mapped to route "/myusers/**" (no version detected) This feature is disable by default and only applies to discovered services.
这个意思是说"myusers-v1"将会匹配路由"/v1/myusers/**". 任何正则表达式都可以, 但是所有组必须存在于servicePattern和routePattern之中. 如果servicePattern不匹配服务ID,则使用默认行为. 在上面例子中,一个服务ID为“myusers”将被映射到路径“/ myusers/**”(没有版本被检测到),这个功能默认是关闭的,并且仅适用于服务注册的服务。
To add a prefix to all mappings, set zuul.prefix to a value, such as
/api. The proxy prefix is stripped from the request before the
request is forwarded by default (switch this behaviour off with
zuul.stripPrefix=false). You can also switch off the stripping of
the service-specific prefix from individual routes, e.g.
设置 zuul.prefix 可以为所有的匹配增加前缀, 例如 /api . 代理前缀默认会从请求路径中移除(通过 zuul.stripPrefix=false 可以关闭这个功能). 你也可以在指定服务中关闭这个功能, 例如:
 zuul:
  routes:
    users:
      path: /myusers/**
      stripPrefix: false
In this example, requests to "/myusers/101" will be forwarded to "/myusers/101" on the "users" service.
在这个例子中, 请求"/myusers/101"将被跳转到"users"服务的"/myusers/101"上.
The zuul.routes entries actually bind to an object of type ZuulProperties. If you
look at the properties of that object you will see that it also has a "retryable" flag.
Set that flag to "true" to have the Ribbon client automatically retry failed requests
(and if you need to you can modify the parameters of the retry operations using
the Ribbon client configuration).
zuul.routes 实际上绑定到类型为 ZuulProperties 的对象上. 如果你查看这个对象你会发现一个叫"retryable"的字段, 设置为"true"会使Ribbon客户端自动在失败时重试(如果你需要修改重试参数, 直接使用Ribbon客户端的配置)
The X-Forwarded-Host header is added to the forwarded requests by
default. To turn it off set zuul.addProxyHeaders = false. The
prefix path is stripped by default, and the request to the backend
picks up a header "X-Forwarded-Prefix" ("/myusers" in the examples
above).
X-Forwarded-Host 请求头默认在跳转时添加. 通过设置 zuul.addProxyHeaders = false 关闭它. 前缀路径默认剥离, 并且对于后端的请求通过请求头"X-Forwarded-Prefix"获取(上面的例子中是"/myusers")
An application with @EnableZuulProxy could act as a standalone
server if you set a default route ("/"), for example zuul.route.home:
/ would route all traffic (i.e. "/**") to the "home" service.
通过 @EnableZuulProxy 应用程序可以作为一个独立的服务, 如果你想设置一个默认路由("/"), 比如 zuul.route.home: / 将路由所有的请求(例如: "/**")到"home"服务.
If more fine-grained ignoring is needed, you can specify specific patterns to ignore. These patterns are evaluated at the start of the route location process, which means prefixes should be included in the pattern to warrant a match. Ignored patterns span all services and supersede any other route specification.
如果需要更细力度的忽略, 你可以指定特殊的表达式来配置忽略. 这些表达式从路由位置的头开始匹配, 意味着前缀应该被包括在匹配表达式中. 忽略表达式影响所有服务和取代任何路由的特殊配置.
 zuul:
  ignoredPatterns: /**/admin/**
  routes:
    users: /myusers/**
This means that all calls such as "/myusers/101" will be forwarded to "/101" on the "users" service. But calls including "/admin/" will not resolve.
这个的意思是所有请求, 比如"/myusers/101"的请求会跳转到"users"服务的"/101", 但包含"/admin/"的请求将不被处理.
Cookies和敏感HTTP头(Cookies and Sensitive Headers)
It’s OK to share headers between services in the same system, but you probably don’t want sensitive headers leaking downstream into external servers. You can specify a list of ignored headers as part of the route configuration. Cookies play a special role because they have well-defined semantics in browsers, and they are always to be treated as sensitive. If the consumer of your proxy is a browser, then cookies for downstream services also cause problems for the user because they all get jumbled up (all downstream services look like they come from the same place).
在同一个系统中服务间共享请求头是可行的, 但是你可能不想敏感的头信息泄露到内部系统的下游。 你可以在路由配置中指定一批忽略的请求头列表。 Cookies扮演了一个特殊的角色, 因为他们很好的被定义在浏览器中, 而且他们总是被认为是敏感的. 如果代理的客户端是浏览器, 则对于下游服务来说对用户, cookies会引起问题, 因为他们都混在一起。(所有下游服务看起来认为他们来自同一个地方)。
If you are careful with the design of your services, for example if only one of the downstream services sets cookies, then you might be able to let them flow from the backend all the way up to the caller. Also, if your proxy sets cookies and all your back end services are part of the same system, it can be natural to simply share them (and for instance use Spring Session to link them up to some shared state). Other than that, any cookies that get set by downstream services are likely to be not very useful to the caller, so it is recommended that you make (at least) "Set-Cookie" and "Cookie" into sensitive headers for routes that are not part of your domain. Even for routes that are part of your domain, try to think carefully about what it means before allowing cookies to flow between them and the proxy.
你得小心你的服务设计, 比如即使只有一个下游服务设置cookies, 你都必须让他们回溯设置所有的调用路线. 当然, 如果你的代理设置cookies和你所有后端服务是同一个系统的一部分, 它可以自然的被简单分享(例如, 使用spring session去将它们联系在一起共享状态). 除此之外, 任何被下游设置的cookies可能不是很有用, 推荐你对于不属于你域名部分的路由添加(至少)"Set-Cookie"和"Cookie" 到敏感头. 即使是属于你的域名的路由, 尝试仔细思考在允许cookies流传在它们和代理之间的意义。
The sensitive headers can be configured as a comma-separated list per route, e.g.
每个路由中的敏感头部信息配置按照逗号分隔, 例如:
 zuul:
  routes:
    users:
      path: /myusers/**
      sensitiveHeaders: Cookie,Set-Cookie,Authorization
      url: https://downstream
Sensitive headers can also be set globally by setting zuul.sensitiveHeaders. If sensitiveHeaders is set on a route, this will override the global sensitiveHeaders setting.
敏感头部也支持全局设置 zuul.sensitiveHeaders. 如果在单个路由中设置 sensitiveHeaders 会覆盖全局 sensitiveHeaders 设置.
this is the default value for sensitiveHeaders, so you don’t
need to set it unless you want it to be different. N.B. this is new in
Spring Cloud Netflix 1.1 (in 1.0 the user had no control over headers
and all cookies flow in both directions).
|
注意: 这是sensitiveHeaders 的默认值, 你无需设置除非你需要不同的配置. 注. 这是Spring Cloud Netflix 1.1的新功能(在1.0中, 用户无法直接控制请求头和所有cookies).
In addition to the per-route sensitive headers, you can set a global
value for zuul.ignoredHeaders for values that should be discarded
(both request and response) during interactions with downstream
services. By default these are empty, if Spring Security is not on the
classpath, and otherwise they are initialized to a set of well-known
"security" headers (e.g. involving caching) as specified by Spring
Security. The assumption in this case is that the downstream services
might add these headers too, and we want the values from the proxy.
除了per-route敏感头以外, 你可以设置一个全局的 zuul.ignoredHeaders 在下游相互调用间去丢弃这些值(包括请求和响应). 如果没有将Spring Security
添加到运行路径中, 他们默认是空的, 否则他们会被Spring Secuity初始化一批安全头(例如 缓存相关). 在这种情况下, 假设下游服务也可能添加这些头信息, 我希望从代理获取值.
路由Endpoint(The Routes Endpoint)
If you are using @EnableZuulProxy with tha Spring Boot Actuator you
will enable (by default) an additional endpoint, available via HTTP as
/routes. A GET to this endpoint will return a list of the mapped
routes. A POST will force a refresh of the existing routes (e.g. in
case there have been changes in the service catalog).
如果你使用 @EnableZuulProxy 同时引入了Spring Boot Actuator, 你将默认增加一个endpoint, 提供http服务的 /routes. 一个GET请求将返回路由匹配列表.
一个POST请求将强制刷新已存在的路由.(比如, 在服务catalog变化的场景中)
| the routes should respond automatically to changes in the service catalog, but the POST to /routes is a way to force the change to happen immediately. |
| 路由列表应该自动应答服务登记变化, 但是POST是一种强制立即更新的方案. |
窒息模式和本地跳转(Strangulation Patterns and Local Forwards)
A common pattern when migrating an existing application or API is to "strangle" old endpoints, slowly replacing them with different implementations. The Zuul proxy is a useful tool for this because you can use it to handle all traffic from clients of the old endpoints, but redirect some of the requests to new ones.
逐步替代旧的接口是一种通用的迁移现有应用程序或者API的方式, 使用不同的具体实现逐步替换它们. Zuul代理是一种很有用的工具, 因为你可以使用这种方式处理所有客户端到旧接口的请求. 只是重定向了一些请求到新的接口.
Example configuration:
配置样例:
 zuul:
  routes:
    first:
      path: /first/**
      url: http://first.example.com
    second:
      path: /second/**
      url: forward:/second
    third:
      path: /third/**
      url: forward:/3rd
    legacy:
      path: /**
      url: http://legacy.example.com
In this example we are strangling the "legacy" app which is mapped to
all requests that do not match one of the other patterns. Paths in
/first/** have been extracted into a new service with an external
URL. And paths in /second/** are forwared so they can be handled
locally, e.g. with a normal Spring @RequestMapping. Paths in
/third/** are also forwarded, but with a different prefix
(i.e. /third/foo is forwarded to /3rd/foo).
在这个例子中我们逐步替换除了部分请求外所有到"legacy"应用的请求. 路径 /first/** 指向了一个额外的URL. 并且路径 /second/** 是一个跳转, 所以请求可以被本地处理.
比如, 带有Spring注解的 @RequestMapping . 路径 /third/** 也是一个跳转, 但是属于一个不同的前缀. (比如 /third/foo 跳转到 /3rd/foo )
| The ignored patterns aren’t completely ignored, they just aren’t handled by the proxy (so they are also effectively forwarded locally). |
| 忽略表达式并不是完全的忽略请求, 只是配置这个代理不处理这些请求(所以他们也是跳转执行本地处理) |
通过Zuul上传文件(Uploading Files through Zuul)
If you @EnableZuulProxy you can use the proxy paths to
upload files and it should just work as long as the files
are small. For large files there is an alternative path
which bypasses the Spring DispatcherServlet (to
avoid multipart processing) in "/zuul/*". I.e. if
zuul.routes.customers=/customers/** then you can
POST large files to "/zuul/customers/*". The servlet
path is externalized via zuul.servletPath. Extremely
large files will also require elevated timeout settings
if the proxy route takes you through a Ribbon load
balancer, e.g.
如果你使用 @EnableZuulProxy , 你可以使用代理路径上传文件, 它能够一直正常工作只要小文件. 对于大文件有可选的路径"/zuul/*"绕过Spring DispatcherServlet (避免处理multipart).
比如对于 zuul.routes.customers=/customers/** , 你可以使用 "/zuul/customers/*" 去上传大文件. Servlet路径通过 zuul.servletPath 指定. 如果使用Ribbon负载均衡器的代理路由, 在
处理非常大的文件时, 仍然需要提高超时配置. 比如:
hystrix.command.default.execution.isolation.thread.timeoutInMilliseconds: 60000
ribbon:
  ConnectTimeout: 3000
  ReadTimeout: 60000
Note that for streaming to work with large files, you need to use chunked encoding in the request (which some browsers do not do by default). E.g. on the command line:
注意: 对于大文件的上传流, 你应该在请求中使用块编码. (有些浏览器默认不这么做). 比如在命令行中:
$ curl -v -H "Transfer-Encoding: chunked" \
    -F "file=@mylarge.iso" localhost:9999/zuul/simple/file
简单的嵌入Zuul(Plain Embedded Zuul)
You can also run a Zuul server without the proxying, or switch on parts of the proxying platform selectively, if you
use @EnableZuulServer (instead of @EnableZuulProxy). Any beans that you add to the application of type ZuulFilter
will be installed automatically, as they are with @EnableZuulProxy, but without any of the proxy filters being added
automatically.
你可以运行一个没有代理功能的Zuul服务, 或者有选择的开关部分代理功能, 如果你使用 @EnableZuulServer (替代 @EnableZuulProxy ). 你添加的任何 ZuulFilter 类型
实体类都会被自动加载, 和使用 @EnableZuulProxy 一样, 但不会自动加载任何代理过滤器.
In this case the routes into the Zuul server are still specified by configuring "zuul.routes.*", but there is no service discovery and no proxying, so the "serviceId" and "url" settings are ignored. For example:
在以下例子中, Zuul服务中的路由仍然是按照 "zuul.routes.*"指定, 但是没有服务发现和代理, 因此"serviceId"和"url"配置会被忽略. 比如:
 zuul:
  routes:
    api: /api/**
maps all paths in "/api/**" to the Zuul filter chain.
匹配所有路径 "/api/**" 给Zuul过滤器链.
关闭Zuul过滤器(Disable Zuul Filters)
Zuul for Spring Cloud comes with a number of ZuulFilter beans enabled by default
in both proxy and server mode. See the zuul filters package for the
possible filters that are enabled. If you want to disable one, simply set
zuul.<SimpleClassName>.<filterType>.disable=true. By convention, the package after
filters is the Zuul filter type. For example to disable
org.springframework.cloud.netflix.zuul.filters.post.SendResponseFilter set
zuul.SendResponseFilter.post.disable=true.
在代理和服务模式下, 对于Spring Cloud, Zuul默认加入了一批 ZuulFilter 类. 查阅 the zuul filters package
去获取可能开启的过滤器. 如果你想关闭其中一个, 可以简单的设置 zuul.<SimpleClassName>.<filterType>.disable=true . 按照约定, 在 filter 后面的包是Zuul过滤器类.
比如关闭 org.springframework.cloud.netflix.zuul.filters.post.SendResponseFilter , 可设置zuul.SendResponseFilter.post.disable=true.
通过Sidecar进行多语言支持(Polyglot support with Sidecar)
Do you have non-jvm languages you want to take advantage of Eureka, Ribbon and Config Server? The Spring Cloud Netflix Sidecar was inspired by Netflix Prana. It includes a simple http api to get all of the instances (ie host and port) for a given service. You can also proxy service calls through an embedded Zuul proxy which gets its route entries from Eureka. The Spring Cloud Config Server can be accessed directly via host lookup or through the Zuul Proxy. The non-jvm app should implement a health check so the Sidecar can report to eureka if the app is up or down.
你是否有非jvm语言应用程序需要使用Eureka, Ribbon和Config Server的功能? Spring Cloud Netflix Sidecar 受 Netflix Prana 启发. 它包含一个简单的HTTP API去获取所有注册的实例信息(包括host和port信息). 你也可以通过依赖Eureka的嵌入式Zuul代理器代理服务调用. The Spring Cloud Config Server可以通过host查找 或Zuul代理直接进入. 非JVM应用程序提供健康检查实现即可让Sidecar向eureka同步应用程序up还是down.
To enable the Sidecar, create a Spring Boot application with @EnableSidecar.
This annotation includes @EnableCircuitBreaker, @EnableDiscoveryClient,
and @EnableZuulProxy. Run the resulting application on the same host as the
non-jvm application.
为了开启Sidecar, 创建一个包含 @EnableSidecar 的Springboot应用程序. 这个注解包括了 @EnableCircuitBreaker, @EnableDiscoveryClient 和 @EnableZuulProxy .
运行这个程序在非jvm程序的同一台主机上.
To configure the side car add sidecar.port and sidecar.health-uri to application.yml.
The sidecar.port property is the port the non-jvm app is listening on. This
is so the Sidecar can properly register the app with Eureka. The sidecar.health-uri
is a uri accessible on the non-jvm app that mimicks a Spring Boot health
indicator. It should return a json document like the following:
配置Sidecar, 添加 sidecar.port and sidecar.health-uri 到 application.yml 中. 属性 sidecar.port 配置非jvm应用正在监听的端口. 这样Sidecar能够注册应用到
Eureka. sidecar.health-uri 是一个非JVM应用程序提供模仿SpringBoot健康检查接口的可访问的uri. 它应该返回一个json文档类似如下:
{
  "status":"UP"
}
Here is an example application.yml for a Sidecar application:
这个是Sidecar应用程序application.yml的列子:
server:
  port: 5678
spring:
  application:
    name: sidecar

sidecar:
  port: 8000
  health-uri: http://localhost:8000/health.json
The api for the DiscoveryClient.getInstances() method is /hosts/{serviceId}.
Here is an example response for /hosts/customers that returns two instances on
different hosts. This api is accessible to the non-jvm app (if the sidecar is
on port 5678) at http://localhost:5678/hosts/{serviceId}.
DiscoveryClient.getInstances() 方法的API是 /hosts/{serviceId} . 对于 /hosts/customers 响应的例子是返回两个不同hosts的实例. 这个API对于非JVM
应用程序是可访问的. (如果sidecar监听在5678端口上) http://localhost:5678/hosts/{serviceId} .
[
    {
        "host": "myhost",
        "port": 9000,
        "uri": "http://myhost:9000",
        "serviceId": "CUSTOMERS",
        "secure": false
    },
    {
        "host": "myhost2",
        "port": 9000,
        "uri": "http://myhost2:9000",
        "serviceId": "CUSTOMERS",
        "secure": false
    }
]
The Zuul proxy automatically adds routes for each service known in eureka to
/<serviceId>, so the customers service is available at /customers. The
Non-jvm app can access the customer service via http://localhost:5678/customers
(assuming the sidecar is listening on port 5678).
Zuul自动代理所有eureka中的服务, 路径为 /<serviceId> , 也就是customers服务可以通过 /customers 代理到. 非JVM应用程序可以通过
http://localhost:5678/customers 访问customer服务(假设sidecar监听在5678端口上).
If the Config Server is registered with Eureka, non-jvm application can access
it via the Zuul proxy. If the serviceId of the ConfigServer is configserver
and the Sidecar is on port 5678, then it can be accessed at
http://localhost:5678/configserver
如果配置服务已经在eureka里注册, 非JVM应用可以通过Zuul代理访问到它. 如果ConfigServer的serviceId是 configserver 和Sidecar监听在5678端口上, 则它可以通过
http://localhost:5678/configserver 访问到.
Non-jvm app can take advantage of the Config Server’s ability to return YAML documents. For example, a call to http://sidecar.local.spring.io:5678/configserver/default-master.yml might result in a YAML document like the following
非JVM应用可以使用ConfigServer的功能返回YAML文档. 比如, 调用 http://sidecar.local.spring.io:5678/configserver/default-master.yml 可以返回如下文档:
eureka:
  client:
    serviceUrl:
      defaultZone: http://localhost:8761/eureka/
  password: password
info:
  description: Spring Cloud Samples
  url: https://github.com/spring-cloud-samples
RxJava 与 Spring MVC(RxJava with Spring MVC)
Spring Cloud Netflix includes the RxJava.
Spring Cloud Netflix 包含 RxJava.
RxJava is a Java VM implementation of Reactive Extensions: a library for composing asynchronous and event-based programs by using observable sequences.
RxJava是一个Java VM实现http://reactivex.io /(Reactive Extensions):是一个使用可观察数据流进行异步编程的编程接口,ReactiveX结合了观察者模式、迭代器模式和函数式编程的精华。与异步数据流交互的编程范式
Spring Cloud Netflix provides support for returning rx.Single objects from Spring MVC Controllers. It also supports using rx.Observable objects for Server-sent events (SSE). This can be very convenient if your internal APIs are already built using RxJava (see Feign Hystrix Support for examples).
Spring Cloud Netflix提供并支持从Spring MVC Controllers返回rx.Single对象. 它还支持使用 rx.Observable 对象,可观察的对象为 Server-sent events (SSE).
如果你的内部api已经使用RxJava这会非常的方便(见< < spring-cloud-feign-hystrix > >为例)。
Here are some examples of using rx.Single:
这里有一些使用rx.Single的列子:
@RequestMapping(method = RequestMethod.GET, value = "/single")
public Single<String> single() {
    return Single.just("single value");
}

@RequestMapping(method = RequestMethod.GET, value = "/singleWithResponse")
public ResponseEntity<Single<String>> singleWithResponse() {
    return new ResponseEntity<>(Single.just("single value"), HttpStatus.NOT_FOUND);
}

@RequestMapping(method = RequestMethod.GET, value = "/throw")
public Single<Object> error() {
    return Single.error(new RuntimeException("Unexpected"));
}
If you have an Observable, rather than a single, you can use .toSingle() or .toList().toSingle(). Here are some examples:
如果你有一个 Observable, 而不是单一的, 你可以使用.toSingle() 或 .toList().toSingle(). 下面是些例子:
@RequestMapping(method = RequestMethod.GET, value = "/single")
public Single<String> single() {
    return Observable.just("single value").toSingle();
}

@RequestMapping(method = RequestMethod.GET, value = "/multiple")
public Single<List<String>> multiple() {
    return Observable.just("multiple", "values").toList().toSingle();
}

@RequestMapping(method = RequestMethod.GET, value = "/responseWithObservable")
public ResponseEntity<Single<String>> responseWithObservable() {

    Observable<String> observable = Observable.just("single value");
    HttpHeaders headers = new HttpHeaders();
    headers.setContentType(APPLICATION_JSON_UTF8);
    return new ResponseEntity<>(observable.toSingle(), headers, HttpStatus.CREATED);
}

@RequestMapping(method = RequestMethod.GET, value = "/timeout")
public Observable<String> timeout() {
    return Observable.timer(1, TimeUnit.MINUTES).map(new Func1<Long, String>() {
        @Override
        public String call(Long aLong) {
            return "single value";
        }
    });
}
If you have a streaming endpoint and client, SSE could be an option. To convert rx.Observable to a Spring SseEmitter use RxResponse.sse(). Here are some examples:
如果你有一个流端点和客户端,SSE可能是一个选项。使用 RxResponse.sse()将rx.Observable转换到Spring 的SseEmitter. 以下是一些例子:
@RequestMapping(method = RequestMethod.GET, value = "/sse")
public SseEmitter single() {
    return RxResponse.sse(Observable.just("single value"));
}

@RequestMapping(method = RequestMethod.GET, value = "/messages")
public SseEmitter messages() {
    return RxResponse.sse(Observable.just("message 1", "message 2", "message 3"));
}

@RequestMapping(method = RequestMethod.GET, value = "/events")
public SseEmitter event() {
    return RxResponse.sse(APPLICATION_JSON_UTF8, Observable.just(
            new EventDto("Spring io", getDate(2016, 5, 19)),
            new EventDto("SpringOnePlatform", getDate(2016, 8, 1))
    ));
}
指标: Spectator, Servo, and Atlas(Metrics: Spectator, Servo, and Atlas)
When used together, Spectator/Servo and Atlas provide a near real-time operational insight platform.
当Spectator/Servo 和 Atlas一起使用时, 提供一个接近实时操作的平台.
Spectator and Servo are Netflix’s metrics collection libraries. Atlas is a Netflix metrics backend to manage dimensional time series data.
Spectator 和 Servo 的metrics的标准收集库. Atlas 是 Netflix 的一个后端指标 管理多维时间序列数据。
Servo served Netflix for several years and is still usable, but is gradually being phased out in favor of Spectator, which is only designed to work with Java 8. Spring Cloud Netflix provides support for both, but Java 8 based applications are encouraged to use Spectator.
Servo为netflix服务多年,仍然是可用的,但逐渐被淘汰,取而代之的是Spectator ,仅仅是为了与java8工作, Spring Cloud Netflix 两者都支持, 但使用java8的推荐使用Spectator.
Dimensional vs. Hierarchical Metrics
Spring Boot Actuator metrics are hierarchical and metrics are separated only by name. These names often follow a naming convention that embeds key/value attribute pairs (dimensions) into the name separated by periods. Consider the following metrics for two endpoints, root and star-star:
Spring Boot Actuator指标等级和指标是分开的,这些名字常常遵循命名约定,嵌入key/value attribute 隔着时间的名称。考虑以下指标为两个端点,root 和 star-star:
{
    "counter.status.200.root": 20,
    "counter.status.400.root": 3,
    "counter.status.200.star-star": 5,
}
The first metric gives us a normalized count of successful requests against the root endpoint per unit of time. But what if the system had 20 endpoints and you want to get a count of successful requests against all the endpoints? Some hierarchical metrics backends would allow you to specify a wild card such as counter.status.200. that would read all 20 metrics and aggregate the results. Alternatively, you could provide a HandlerInterceptorAdapter that intercepts and records a metric like counter.status.200.all for all successful requests irrespective of the endpoint, but now you must write 20+1 different metrics. Similarly if you want to know the total number of successful requests for all endpoints in the service, you could specify a wild card such as counter.status.2.*.
第一个指标为我们提供了一个规范化的成功请求的时间单位根节点. 归一化计算对根节点成功请求的时间. 但是如果系统有20个节点和你想要一个对所有节点成功请求的计数呢? 分级指标后端将允许您指定一个 counter.status.200. 阅读所有20个指标和聚合的结果.或者,你可以提供一个 HandlerInterceptorAdapter 拦截和记录所有成功的请求无论节点 counter.status.200.all , 但是现在你必须写20多个不同的指标。同样的如果你想知道所有节点成功请求服务的总数, y您可以指定一个通配符 counter.status.2.*.
Even in the presence of wildcarding support on a hierarchical metrics backend, naming consistency can be difficult. Specifically the position of these tags in the name string can slip with time, breaking queries. For example, suppose we add an additional dimension to the hierarchical metrics above for HTTP method. Then counter.status.200.root becomes counter.status.200.method.get.root, etc. Our counter.status.200.* suddenly no longer has the same semantic meaning. Furthermore, if the new dimension is not applied uniformly across the codebase, certain queries may become impossible. This can quickly get out of hand.
即使后端参次指标支持它的存在,命名一致性是很困难的. 特别是这些标签的位置名称字符串可以随着时间的推移,打破查询. 例如, 假设我们为HTTP方法上面的分级指标添加一个额外的dimension . 然后“counter.status.200.root”成为“counter.status.200.method.get.root”等等。我们的“counter.status.200 *’突然不再具有相同的语义。 此外 , 如果新dimension不是整个代码库应用均匀,某些查询可能会变得不可能。这很快就会失控。
Netflix metrics are tagged (a.k.a. dimensional). Each metric has a name, but this single named metric can contain multiple statistics and 'tag' key/value pairs that allows more querying flexibility. In fact, the statistics themselves are recorded in a special tag.
Netflix metrics 标记 (又名 dimensional). 每个指标都有一个名字,但这一命名metric 可以包含多个数据和“标签”键/值对,允许更多查询的灵活性. 事实上, 数据本身是记录在一个特殊的标记中的.
Recorded with Netflix Servo or Spectator, a timer for the root endpoint described above contains 4 statistics per status code, where the count statistic is identical to Spring Boot Actuator’s counter. In the event that we have encountered an HTTP 200 and 400 thus far, there will be 8 available data points:
记录Netflix Servo 或 Spectator, 一个计时器根节点上包含4统计和状态码,Spring Boot Actuator’s 计数的统计数据时相同的. 迄今为止如果我们遇到 HTTP 200 and 400 ,将会有8种可用数据点
{
    "root(status=200,stastic=count)": 20,
    "root(status=200,stastic=max)": 0.7265630630000001,
    "root(status=200,stastic=totalOfSquares)": 0.04759702862580789,
    "root(status=200,stastic=totalTime)": 0.2093076914666667,
    "root(status=400,stastic=count)": 1,
    "root(status=400,stastic=max)": 0,
    "root(status=400,stastic=totalOfSquares)": 0,
    "root(status=400,stastic=totalTime)": 0,
}
默认的 Metrics 集合(Default Metrics Collection)
Without any additional dependencies or configuration, a Spring Cloud based service will autoconfigure a Servo MonitorRegistry and begin collecting metrics on every Spring MVC request. By default, a Servo timer with the name rest will be recorded for each MVC request which is tagged with:
没有任何额外的依赖关系或配置,Spring Cloud 基于云服务可以使用autoconfigure a Servo MonitorRegistry 并开始收集 metrics 在每一个SpringMVC请求上. 默认情况下, Servo 定时器 的名字 rest 将被记录并为每个MVC请求标记:
-
HTTP method
-
HTTP status (e.g. 200, 400, 500)
-
URI (or "root" if the URI is empty), sanitized for Atlas
-
The exception class name, if the request handler threw an exception
-
The caller, if a request header with a key matching
netflix.metrics.rest.callerHeaderis set on the request. There is no default key fornetflix.metrics.rest.callerHeader. You must add it to your application properties if you wish to collect caller information. -
HTTP method
-
HTTP status (e.g. 200, 400, 500)
-
URI (or "root" if the URI is empty), sanitized for Atlas
-
异常类的名称,如果请求处理程序抛出一个异常
-
调用者, 如果一个请求头和一个key
netflix.metrics.rest.callerHeader匹配. callerHeader的设置要求:没有默认的key“netflix.metrics.rest.callerHeader”。您必须将它添加到您的应用程序属性如果你想收集调用信息。
Set the netflix.metrics.rest.metricName property to change the name of the metric from rest to a name you provide.
更改metrics的名字从rest到你提供的一个名字,您所提供的名称设置netflix.metrics.rest.metricName 属性
If Spring AOP is enabled and org.aspectj:aspectjweaver is present on your runtime classpath, Spring Cloud will also collect metrics on every client call made with RestTemplate. A Servo timer with the name of restclient will be recorded for each MVC request which is tagged with:
如果 Spring AOP的启用和org.aspectj:aspectjweaver 是你目前运行时的classpath, Spring Cloud 也会调用创建RestTemplate收集每一个客户端. Servo timer的restclient 将被记录为每个MVC请求标记:
-
HTTP method
-
HTTP status (e.g. 200, 400, 500), "CLIENT_ERROR" if the response returned null, or "IO_ERROR" if an
IOExceptionoccurred during the execution of theRestTemplatemethod -
URI, sanitized for Atlas
-
Client name
-
HTTP method 2.HTTP状态(如200、400、500),如果响应返回null"CLIENT_ERROR",或着创建
RestTemplate方法时抛出"IO_ERROR" -
URI, sanitized for Atlas
-
Client name
Metrics 集合: Spectator(Metrics Collection: Spectator)
To enable Spectator metrics, include a dependency on spring-boot-starter-spectator:
让Spectator metrics包含并依赖spring-boot-starter-spectator:
    <dependency>
        <groupId>org.springframework.cloud</groupId>
        <artifactId>spring-cloud-starter-spectator</artifactId>
    </dependency>
In Spectator parlance, a meter is a named, typed, and tagged configuration and a metric represents the value of a given meter at a point in time. Spectator meters are created and controlled by a registry, which currently has several different implementations. Spectator provides 4 meter types: counter, timer, gauge, and distribution summary.
在 Spectator 里, 一个流量计一个命名的类型和标记的配置和metric表示在某个时间点的给定值. 通过注册表创建Spectator meters和 controlled, 目前有多种不同的实现. Spectator 提供4种类型: counter, timer, gauge, 还有 distribution summary.
Spring Cloud Spectator integration configures an injectable com.netflix.spectator.api.Registry instance for you. Specifically, it configures a ServoRegistry instance in order to unify the collection of REST metrics and the exporting of metrics to the Atlas backend under a single Servo API. Practically, this means that your code may use a mixture of Servo monitors and Spectator meters and both will be scooped up by Spring Boot Actuator MetricReader instances and both will be shipped to the Atlas backend.
Spring Cloud Spectator 整合配置实例为你注入 com.netflix.spectator.api.Registry. 具体来说,为了统一REST指标的集合配置和其他Atlas 后端下单一Servo的API,它配置了一个ServoRegistry 实例. 实际上, 这意味着你的代码可以使用Servo monitors 和 Spectator meters ,双方都将被捞起,由 Spring Boot Actuator MetricReader实例运往Atlas后端.
Spectator 计数器(Spectator Counter)
A counter is used to measure the rate at which some event is occurring.
一个计数器是用于测量其中一些事件发生的速率。
// create a counter with a name and a set of tags
Counter counter = registry.counter("counterName", "tagKey1", "tagValue1", ...);
counter.increment(); // increment when an event occurs
counter.increment(10); // increment by a discrete amount
The counter records a single time-normalized statistic.
该计数器记录一个单一的时间归一化统计。
Spectator Timer
A timer is used to measure how long some event is taking. Spring Cloud automatically records timers for Spring MVC requests and conditionally RestTemplate requests, which can later be used to create dashboards for request related metrics like latency:
计时器是用来测量一些事件正在发生的时间. Spring Cloud 为Spring MVC的请求,定时器和有条件RestTemplate请求自动记录, 以后可以用来创建请求相关的指标,如延迟仪表板:
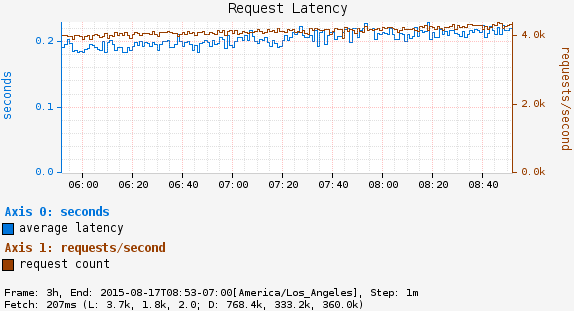
// create a timer with a name and a set of tags
// 创建一个具有名称和一组标签的计时器
Timer timer = registry.timer("timerName", "tagKey1", "tagValue1", ...);

// execute an operation and time it at the same time
// 在同一时间执行的操作,并且一次
T result = timer.record(() -> fooReturnsT());

// alternatively, if you must manually record the time
// 另外,你必须手动记录时间
Long start = System.nanoTime();
T result = fooReturnsT();
timer.record(System.nanoTime() - start, TimeUnit.NANOSECONDS);
The timer simultaneously records 4 statistics: count, max, totalOfSquares, and totalTime. The count statistic will always match the single normalized value provided by a counter if you had called increment() once on the counter for each time you recorded a timing, so it is rarely necessary to count and time separately for a single operation.
计时器同时记录4种统计:计数,最大,总平方和总时间. 如果你调用increment()计数器记录时间,计数统计与单一的标准值总是由计数器设置,,所以很少需要分别计算单个操作时间。
For long running operations, Spectator provides a special LongTaskTimer.
For long running operations, Spectator 提供了一个特殊的 LongTaskTimer.
Spectator Gauge
Gauges are used to determine some current value like the size of a queue or number of threads in a running state. Since gauges are sampled, they provide no information about how these values fluctuate between samples.
仪表用于确定当前的值,如队列的大小或运行状态中的线程数。由于压力表是采样的,它们没有提供关于这些值如何在样品之间波动的信息。
The normal use of a gauge involves registering the gauge once in initialization with an id, a reference to the object to be sampled, and a function to get or compute a numeric value based on the object. The reference to the object is passed in separately and the Spectator registry will keep a weak reference to the object. If the object is garbage collected, then Spectator will automatically drop the registration. See the note in Spectator’s documentation about potential memory leaks if this API is misused.
通常仪表的一旦初始化正常使用包括注册表id,采样对象的引用,和一个函数或计算基于对象的数值. 在 separately 和 Spectator 注册中心将通过弱引用引用对象. 如果对象被垃圾收集,那么Spectator就会自动放弃注册。 See the note 在 Spectator这个文档中关于潜在的内存泄漏,如果这个API被滥用.
// the registry will automatically sample this gauge periodically
// 注册表会自动定期抽样这个gauge
registry.gauge("gaugeName", pool, Pool::numberOfRunningThreads);

// manually sample a value in code at periodic intervals -- last resort!
// 定期手动示例代码中的一个值----最后一招!
registry.gauge("gaugeName", Arrays.asList("tagKey1", "tagValue1", ...), 1000);
Spectator分布式汇总(Spectator Distribution Summaries)
A distribution summary is used to track the distribution of events. It is similar to a timer, but more general in that the size does not have to be a period of time. For example, a distribution summary could be used to measure the payload sizes of requests hitting a server.
一个分布式汇总是用来跟踪事件的分布. 它类似于一个计时器,但更普遍的大小不需要一段时间.举个例子, 分布总结可以测量在服务器上的请求的有效负载大小。
// the registry will automatically sample this gauge periodically
// 注册表会自动定期抽样这个gauge
DistributionSummary ds = registry.distributionSummary("dsName", "tagKey1", "tagValue1", ...);
ds.record(request.sizeInBytes());
Metrics 搜集: Servo(Metrics Collection: Servo)
| If your code is compiled on Java 8, please use Spectator instead of Servo as Spectator is destined to replace Servo entirely in the long term. |
| 如果您的代码Java的编译8,请用Spectator ,而不是作为Servo,Spectator注定要在长期内完全替代Servo. |
In Servo parlance, a monitor is a named, typed, and tagged configuration and a metric represents the value of a given monitor at a point in time. Servo monitors are logically equivalent to Spectator meters. Servo monitors are created and controlled by a MonitorRegistry. In spite of the above warning, Servo does have a wider array of monitor options than Spectator has meters.
在Servo里, monitor是命名的类型和标记的配置和metric代表在某个时间点的给定monitor的值. Servo monitors 逻辑上等同于Spectator meters. Servo monitors 创建并通过 MonitorRegistry控制. 不管上述警告的, Servo 确实比多Spectator一个链接 :https://github.com/Netflix/servo/wiki/Getting-Started[各种各样].
Spring Cloud integration configures an injectable com.netflix.servo.MonitorRegistry instance for you. Once you have created the appropriate Monitor type in Servo, the process of recording data is wholly similar to Spectator.
一旦您创建了适当的Monitor Servo类型,Spring Cloud集成配置可注入 com.netflix.servo.MonitorRegistry 的实例,记录数据的过程是完全类似于Spectator。
创建 Servo Monitors(Creating Servo Monitors)
If you are using the Servo MonitorRegistry instance provided by Spring Cloud (specifically, an instance of DefaultMonitorRegistry), Servo provides convenience classes for retrieving counters and timers. These convenience classes ensure that only one Monitor is registered for each unique combination of name and tags.
如果你使用的是 Spring Cloud 提供的Servo MonitorRegistry实例,Servo 类用于提供检索方便
counters and timers. These convenience classes ensure that only one Monitor is registered for each unique combination of name and tags.
To manually create a Monitor type in Servo, especially for the more exotic monitor types for which convenience methods are not provided, instantiate the appropriate type by providing a MonitorConfig instance:
手动创建一个监视器类型,尤其是对于更奇特的显示器类型不提供便利的方法,通过提供'MonitorConfig`实例,实例化适当的类型:
MonitorConfig config = MonitorConfig.builder("timerName").withTag("tagKey1", "tagValue1").build();

// somewhere we should cache this Monitor by MonitorConfig
// 我们应该用MonitorConfig缓存这个监视器
Timer timer = new BasicTimer(config);
monitorRegistry.register(timer);
Metrics Backend: Atlas
Atlas was developed by Netflix to manage dimensional time series data for near real-time operational insight. Atlas features in-memory data storage, allowing it to gather and report very large numbers of metrics, very quickly.
Atlas 由Netflix的发展管理多维时间序列数据为实时业务 地图功能内存数据存储,允许它收集和报告非常大量的指标,非常快。
Atlas captures operational intelligence. Whereas business intelligence is data gathered for analyzing trends over time, operational intelligence provides a picture of what is currently happening within a system.
Atlas 抓住了作战情报. 而商业智能数据分析趋势随着时间的推移,作战情报提供的照片目前发生在一个系统.
Spring Cloud provides a spring-cloud-starter-atlas that has all the dependencies you need. Then just annotate your Spring Boot application with @EnableAtlas and provide a location for your running Atlas server with the netflix.atlas.uri property.
Spring Cloud 提供了一个spring-cloud-starter-atlas,它有你所需要的所有依赖项.然后只需要在你的Spring应用程序启动注解@EnableAtlas 和为正在运行的Atlas服务提供一个位置netflix.atlas.uri
Global tags
Spring Cloud enables you to add tags to every metric sent to the Atlas backend. Global tags can be used to separate metrics by application name, environment, region, etc.
Spring Cloud 您可以添加标签发送到Atlas后端每个指标. Global 标签可通过 application name, environment, region, etc等.
Each bean implementing AtlasTagProvider will contribute to the global tag list:
每个 bean 实现 AtlasTagProvider 将有助于Global标记列表:
@Bean
AtlasTagProvider atlasCommonTags(
    @Value("${spring.application.name}") String appName) {
  return () -> Collections.singletonMap("app", appName);
}
使用Atlas(Using Atlas)
To bootstrap a in-memory standalone Atlas instance:
引导一个内存中的独立Atlas实例:
$ curl -LO https://github.com/Netflix/atlas/releases/download/v1.4.2/atlas-1.4.2-standalone.jar
$ java -jar atlas-1.4.2-standalone.jar| An Atlas standalone node running on an r3.2xlarge (61GB RAM) can handle roughly 2 million metrics per minute for a given 6 hour window. |
| Atlas的一个独立的节点上运行r3.2xlarge(61gb RAM)可以处理大约200万个指标,每分钟为6小时的窗口。 |
Once running and you have collected a handful of metrics, verify that your setup is correct by listing tags on the Atlas server:
一旦运行,你收集的指标屈指可数,验证您的设置是通过列出阿特拉斯服务器上的标签正确的:
$ curl http://ATLAS/api/v1/tags
After executing several requests against your service, you can gather some very basic information on the request latency of every request by pasting the following url in your browser: http://ATLAS/api/v1/graph?q=name,rest,:eq,:avg
|
TIP:在对您的服务执行多个请求之后,您可以通过在浏览器上粘贴以下网址来收集每个请求的请求延迟的一些非常基本的信息: http://ATLAS/api/v1/graph?q=name,rest,:eq,:avg
The Atlas wiki contains a compilation of sample queries for various scenarios.
The Atlas wiki 包含一个链接:https://github.com/Netflix/atlas/wiki/Single-Line[compilation of sample queries] 各种场景的示例查询.
Make sure to check out the alerting philosophy and docs on using double exponential smoothing to generate dynamic alert thresholds.
请务必检查链接:https://github.com/Netflix/atlas/wiki/Alerting-Philosophy[alerting philosophy] 和 docs 使用 链接:https://github.com/Netflix/atlas/wiki/DES[double exponential smoothing] 生成动态预警阈值.